WARNING: Experimental data, do NOT use for decision making! Use data from your local weather service.
A note about time.To ensure consistency around the world, weather data is always in Coordinated Universal Time (abbreviated as UTC as a weird compromise between English and the French Temps Universel Coordonné). The abbreviation itself is usually abbreviated as "Z" for "Zulu" time. That came from the fact that the Greenwich Meridian used by the old time reference system (which is the same as the new reference system), "Greenwich Mean Time", is on the zero longitude line. Here's a link to a longer explaination.
TL;DR? It's actually simple: UTC = GMT = Z. What matters is that the US East Coast is either 4 hours (Eastern Daylight Time) or 5 hours (Standard Time) behind UTC. All of these maps are time stamped in UTC. This page was generated at
Sat Jun 20 21:40:47 UTC 2026
Sat Jun 20 17:40:47 EDT 2026
Today is day number 171 of 2026 (used in some satellite data).
Of course, Click any image to embiggen.
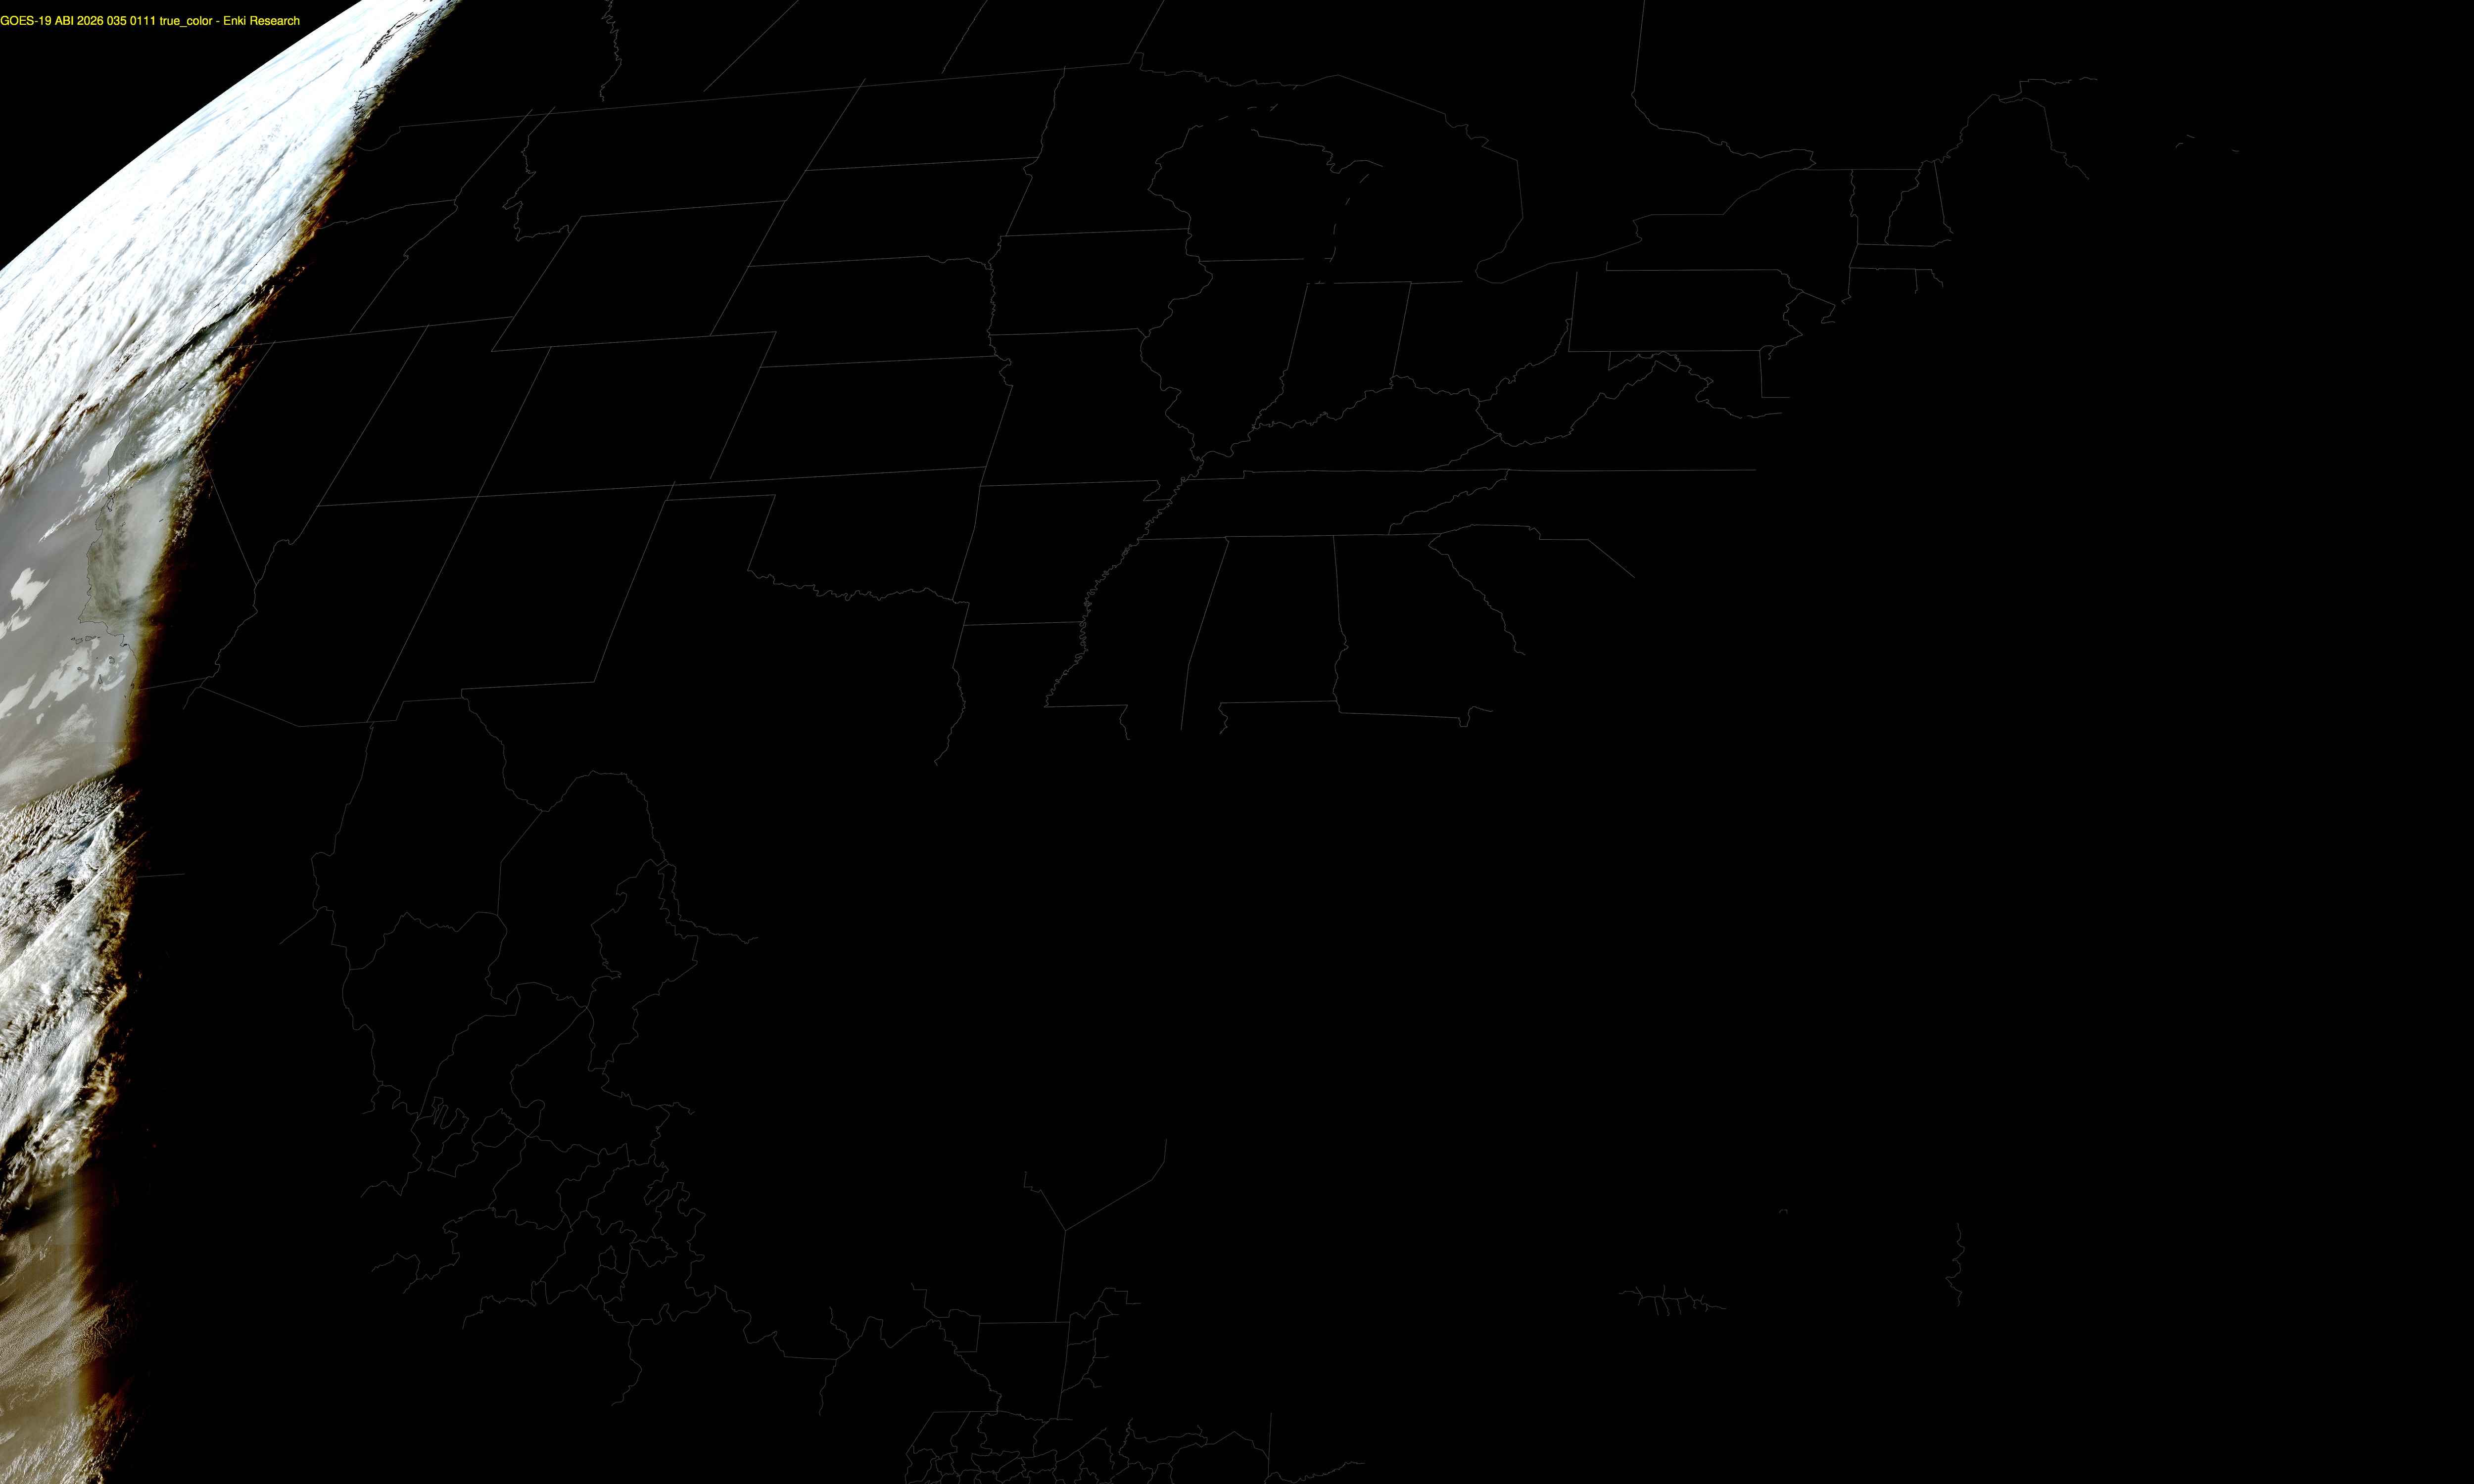
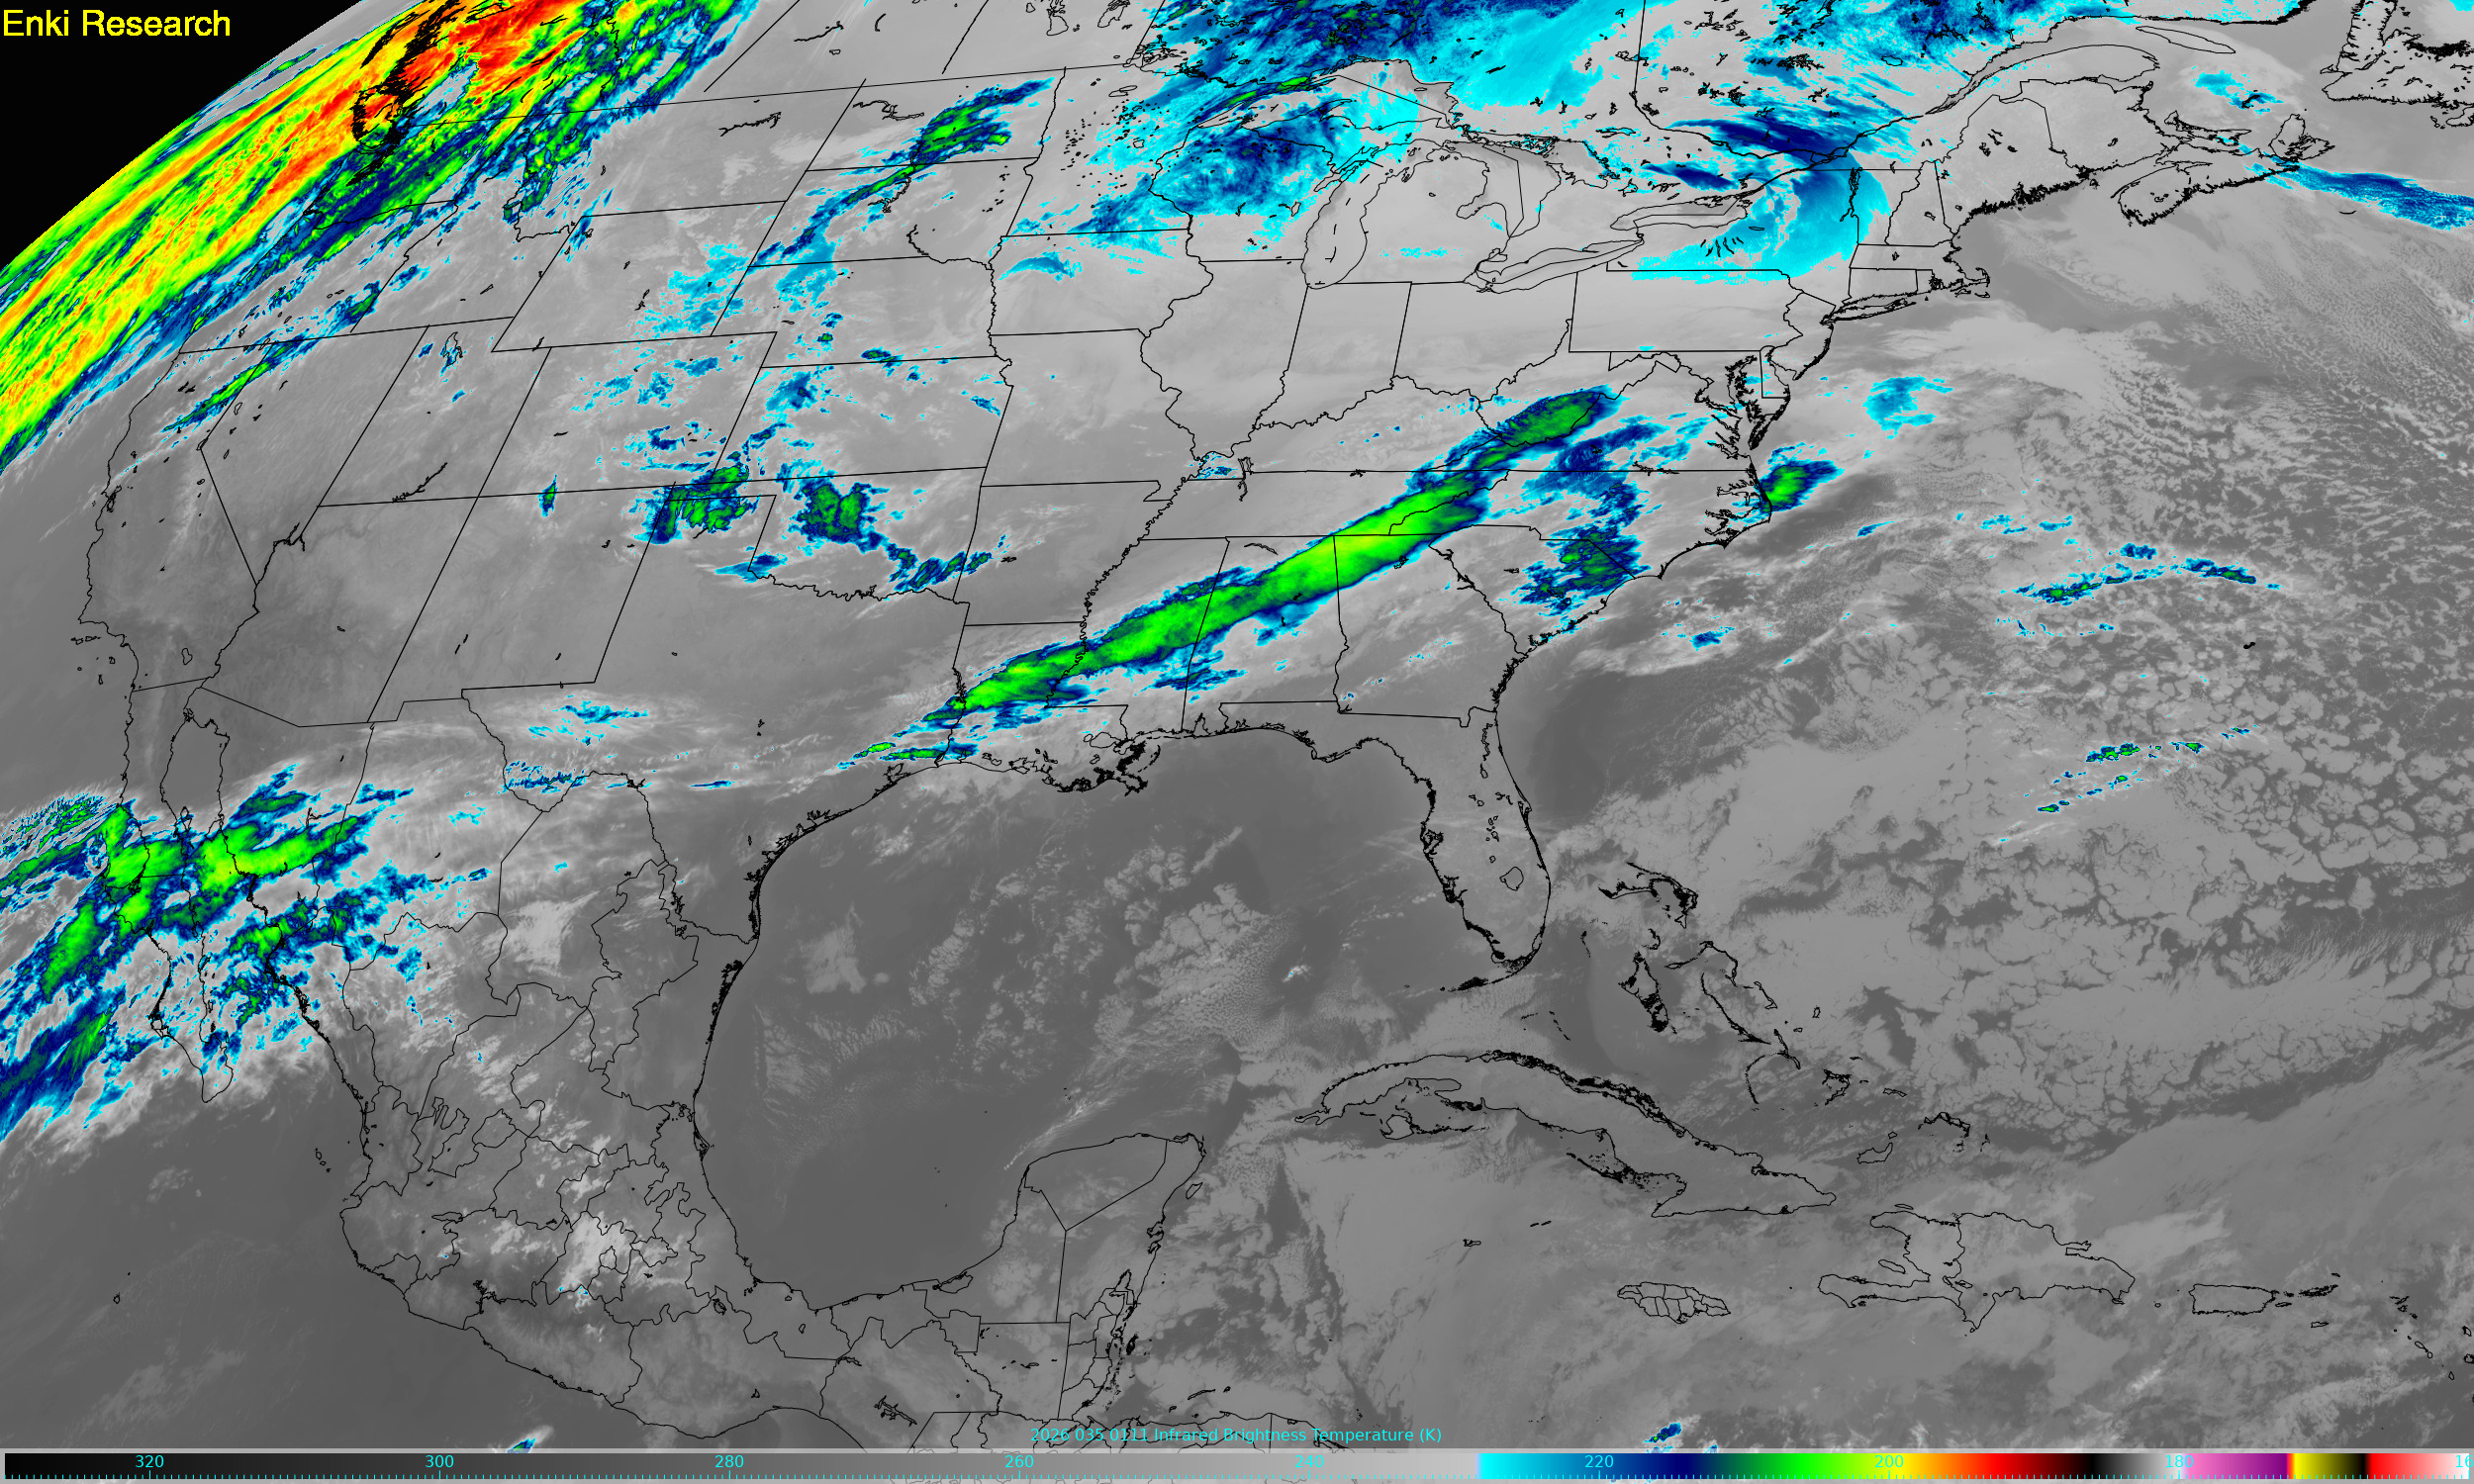
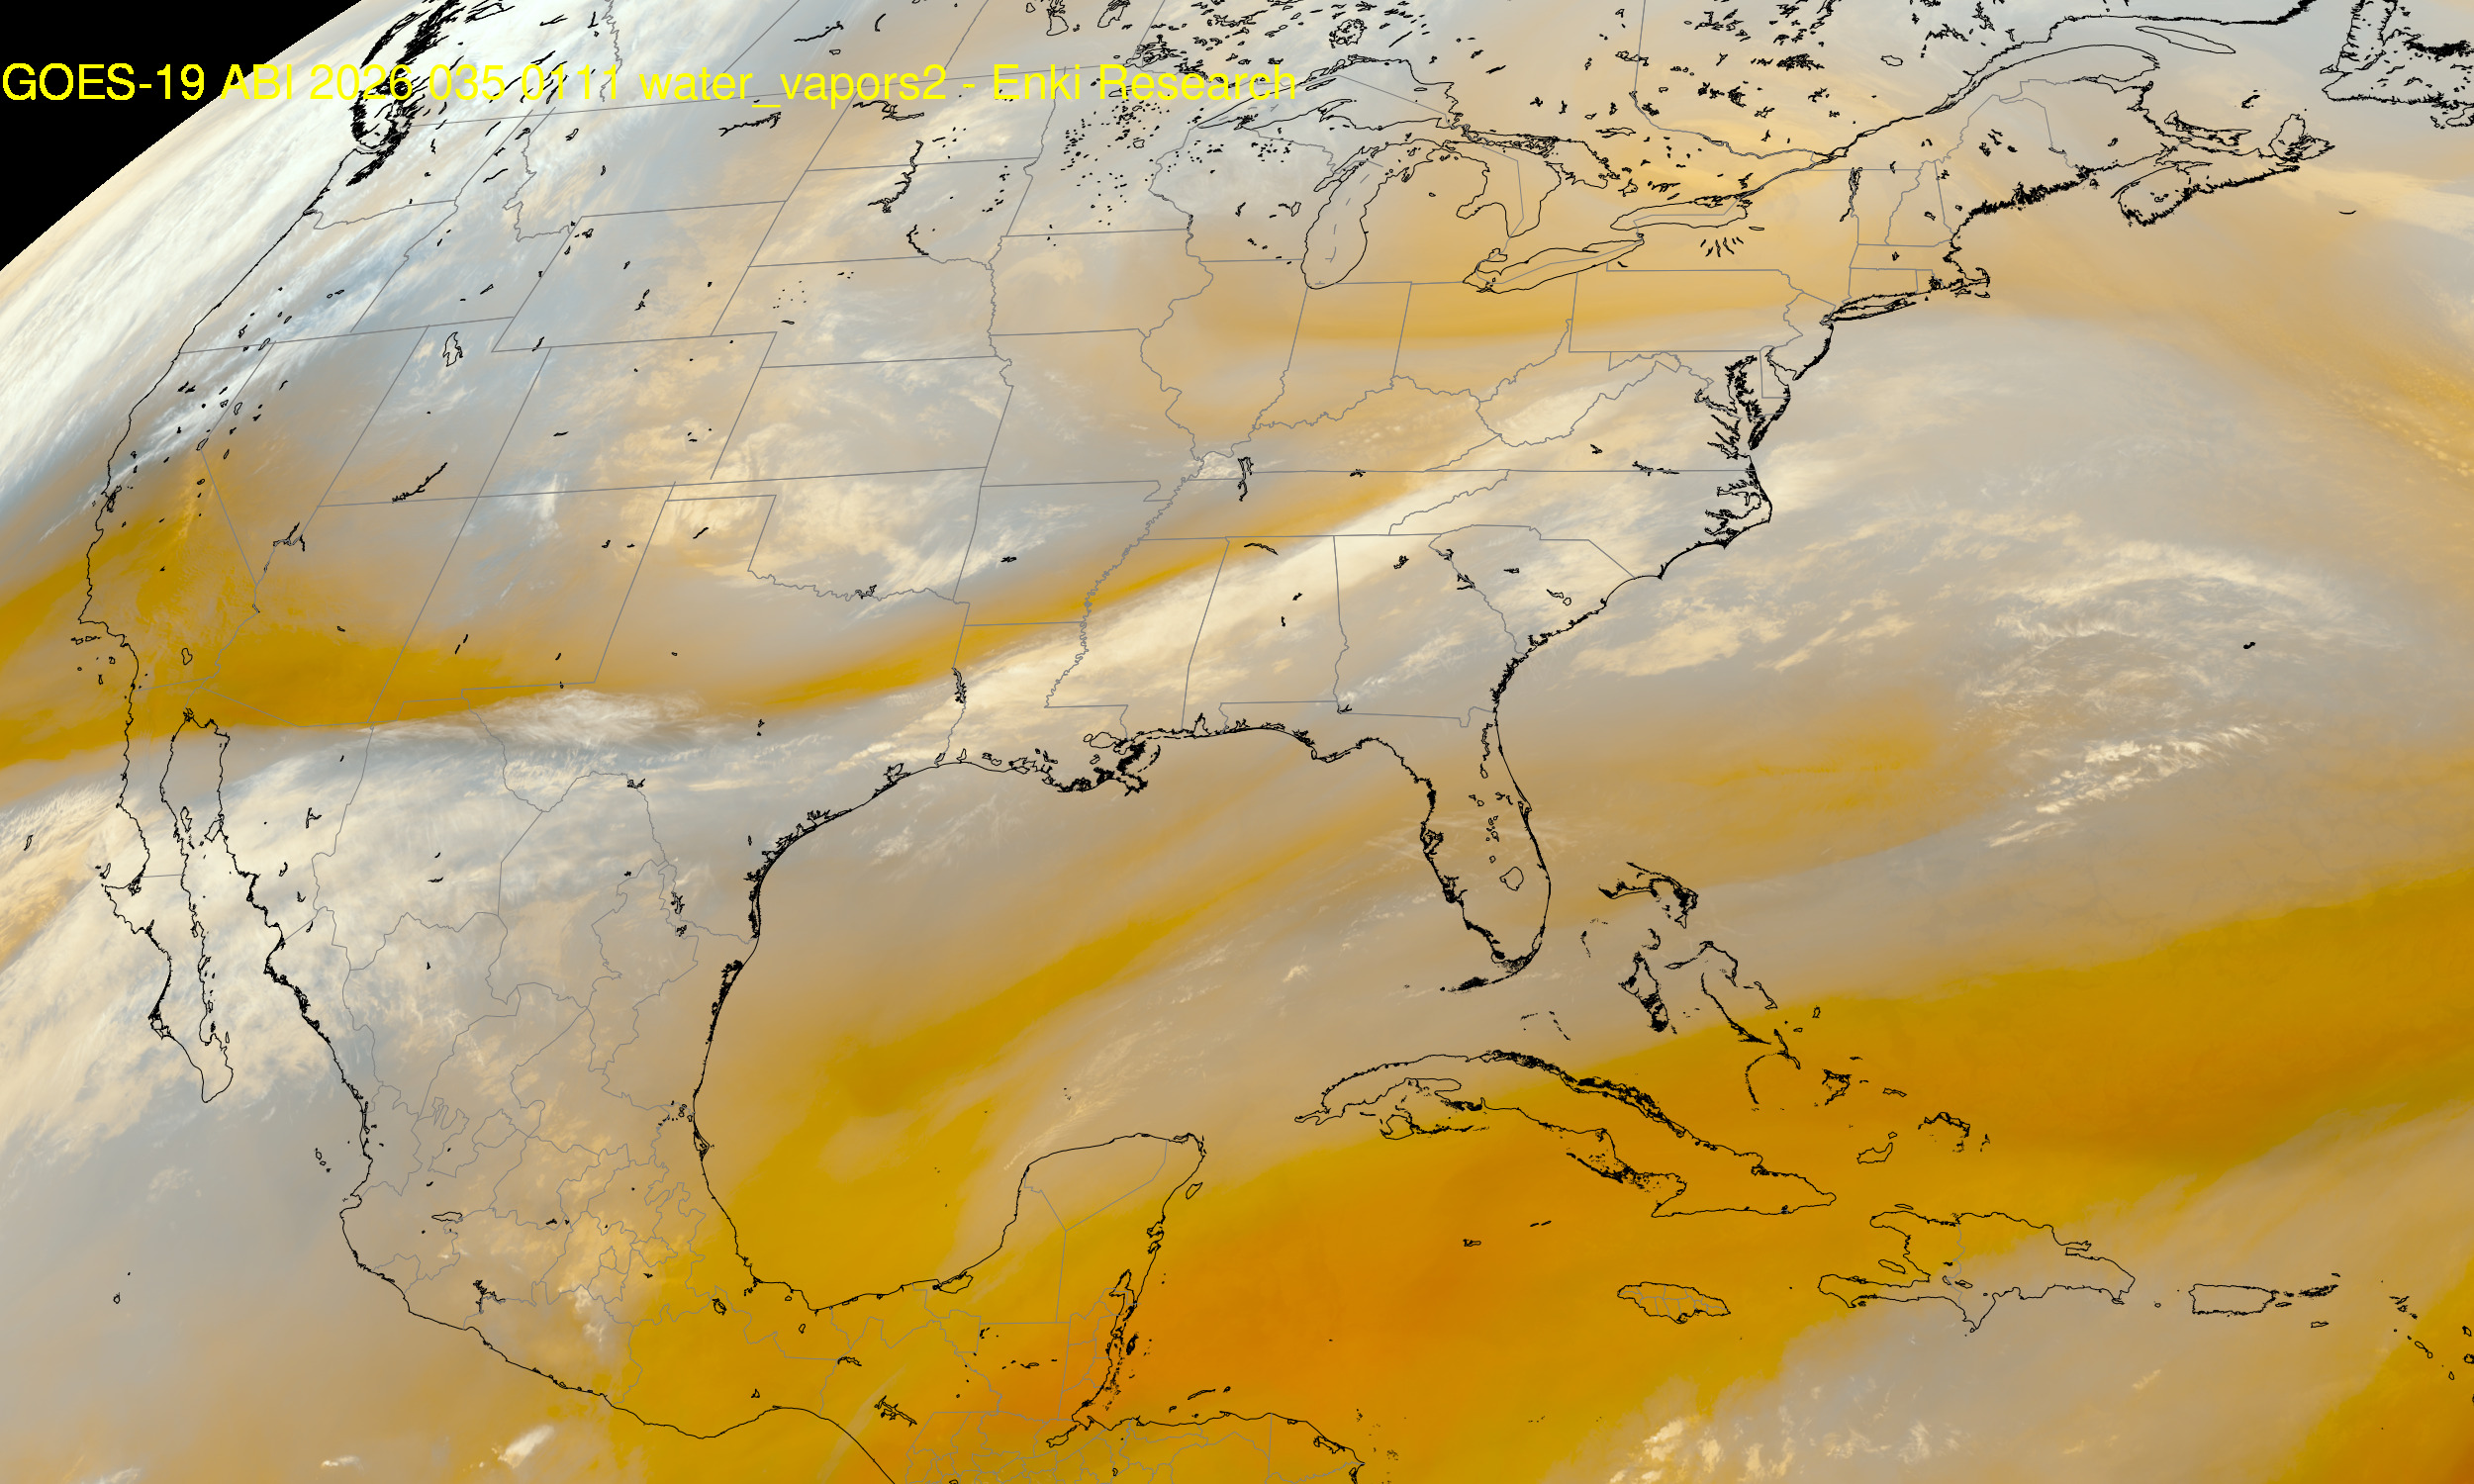
These images are from the GOES East GRB satellite downlink, processed here at Enki. The "True Color" image is a composite of red, green, and blue bands to create a visual color image. It will be black at night. The center image is infrared, with warmer temperatures in grays and with the clouds color coded so higher/colder clouds are various colors since colder cloud tops generally indicate stronger storms. The right image shows water content in the middle part of the atmosphere. Browns are dry, white has more moisture in it.
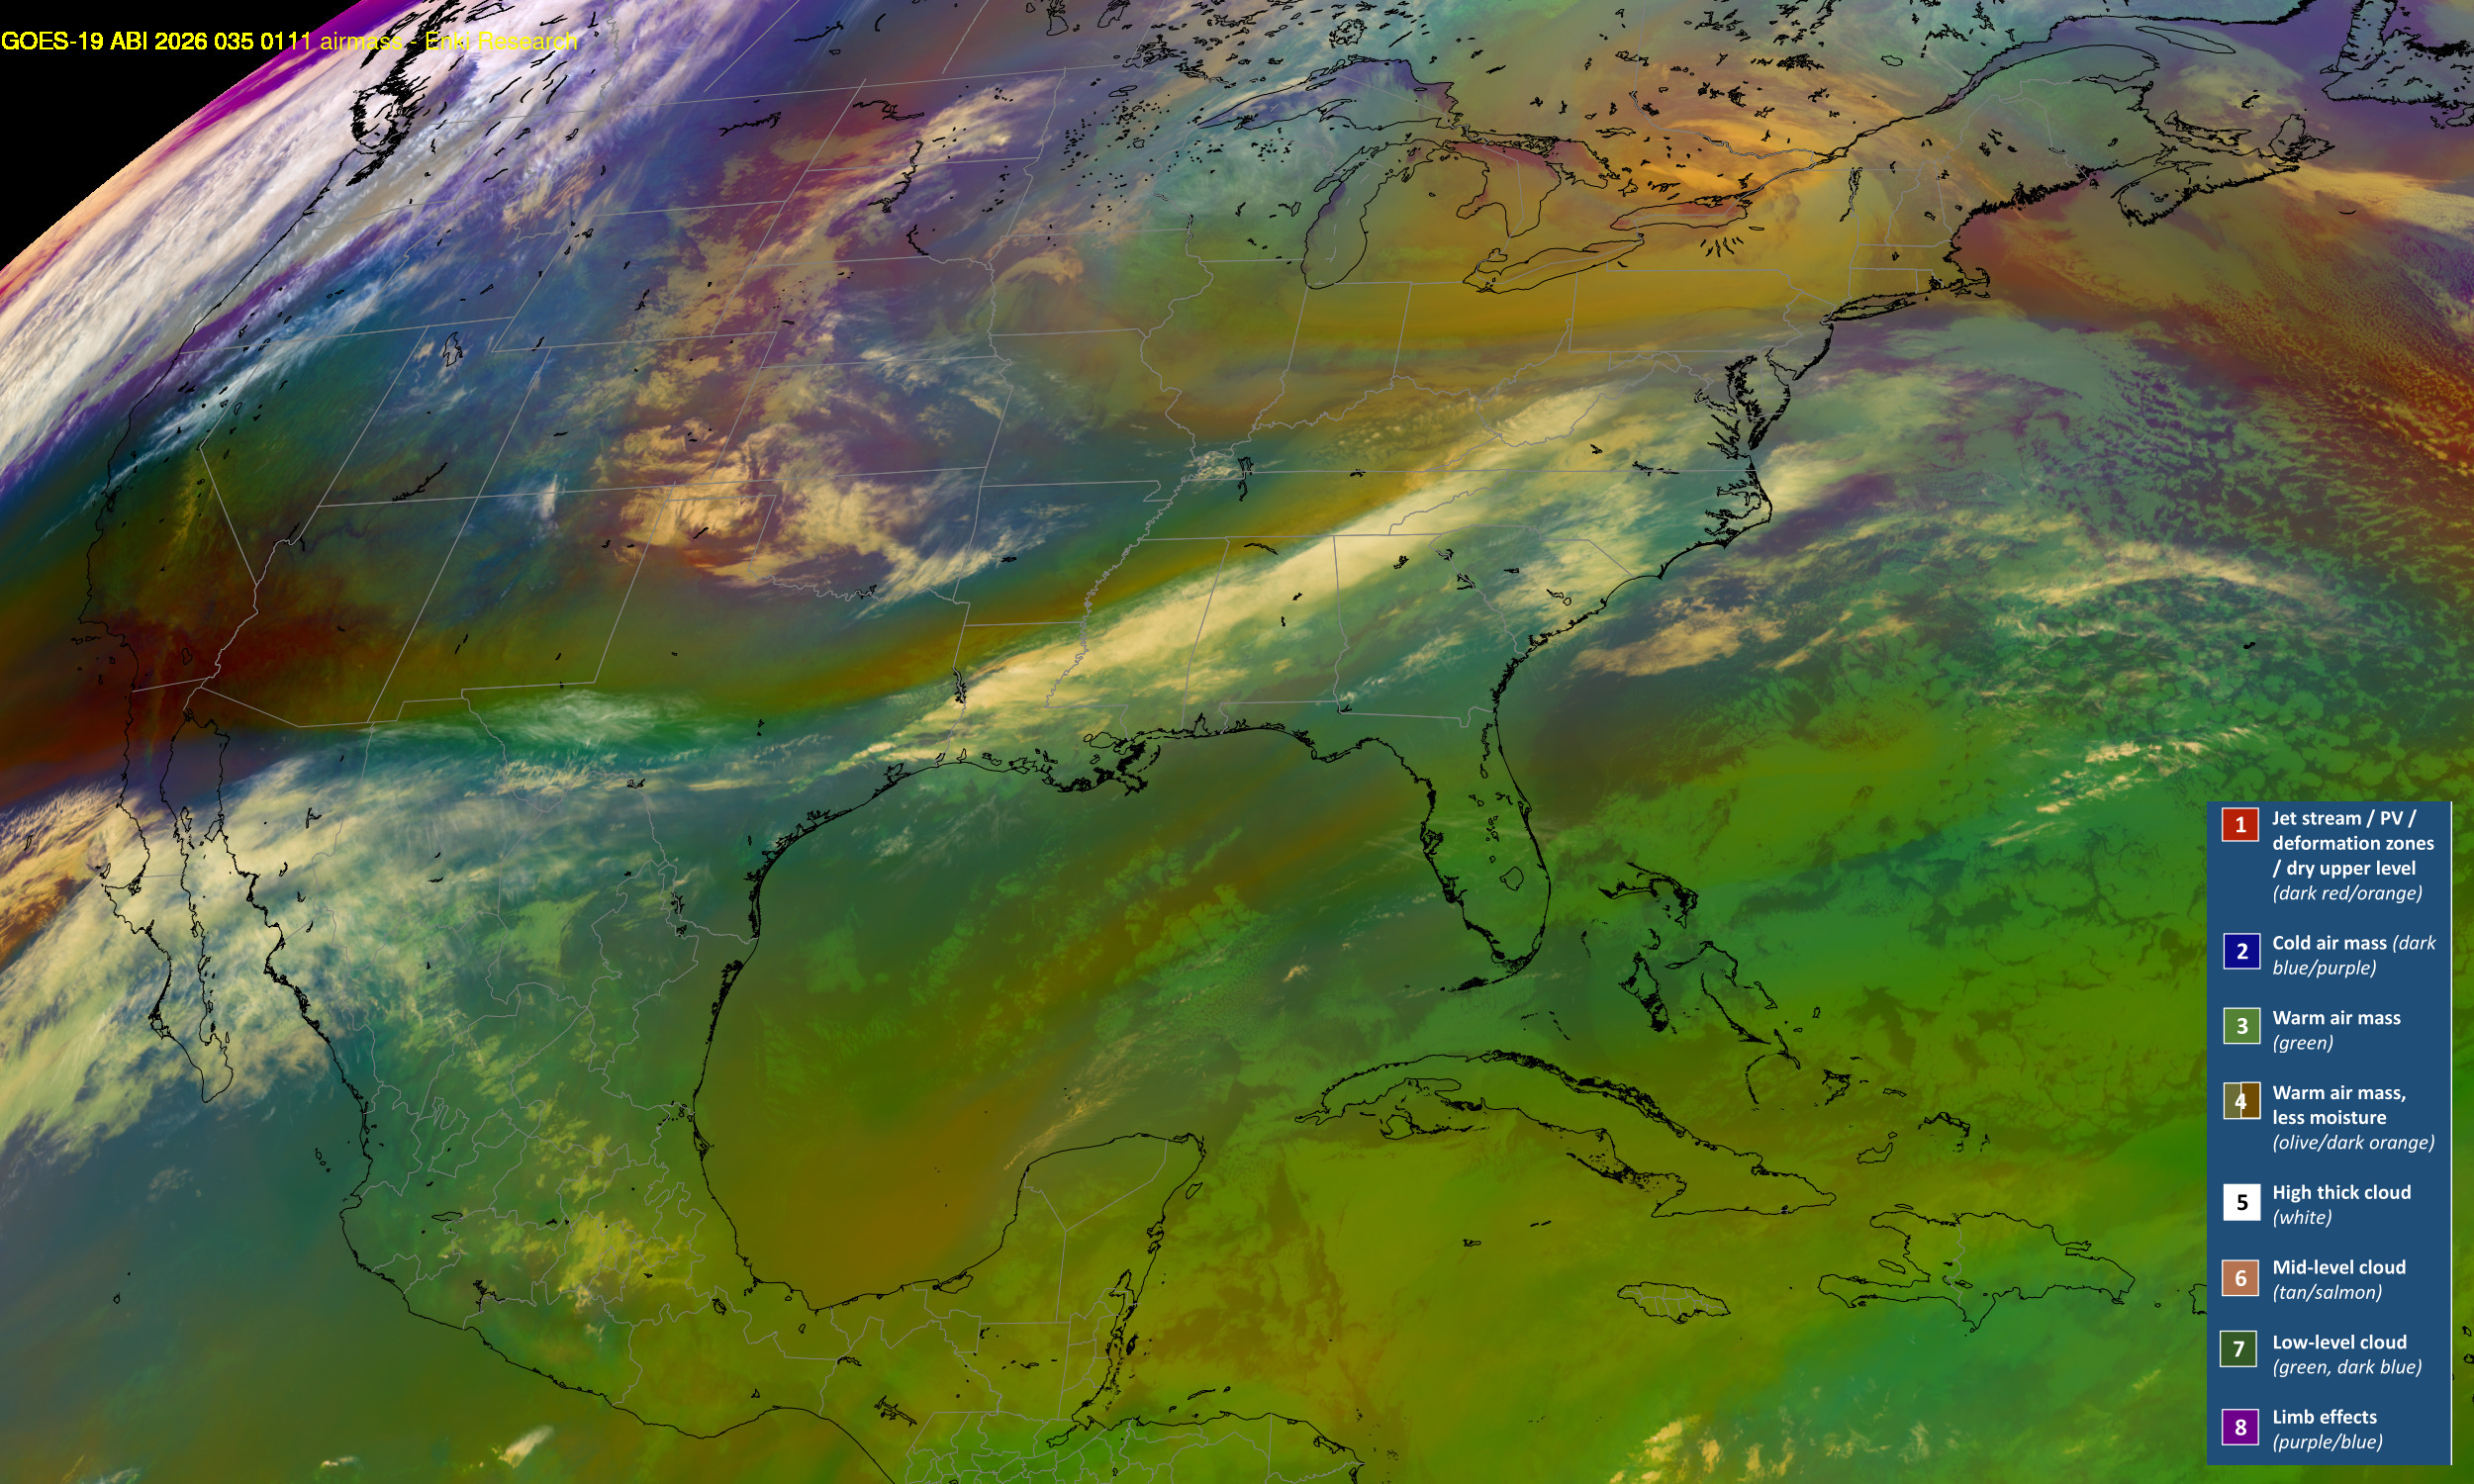
The next three images are products created by combining some of the sixteen GOES Image bands in a way to emphasize certain features of the atmosphere or surface. The first is called the Air Mass product. You can learn more about it here. The second is a mashup of two products designed to analyze the microphysics - temperature, ice content, moiisture - of clouds and the atmosphere. Click here for more info. The third is called the fire temperature RGB product. The quick-guide for it is here.
| True Color Visual | RGBIR (Temperature) | Water Vapor |
|---|---|---|
| |
|
|
| Air Mass | Microphysics | Fire Temperature |
| |
|
|
MRMS is the Multi Radar Multi Sensor system that integrates data from the national NEXRAD
radar network as well as surface observations to provide a uniform data layer. Here two data outputs are used, the low
level radar reflectivity, and ground strikes over the last 15 minutes from the National Lightning Detection Network and
processed by the MRMS system. MRMS data updates every 10 minutes.
| Reflectivity | Lightning |
|---|---|
 |
 |
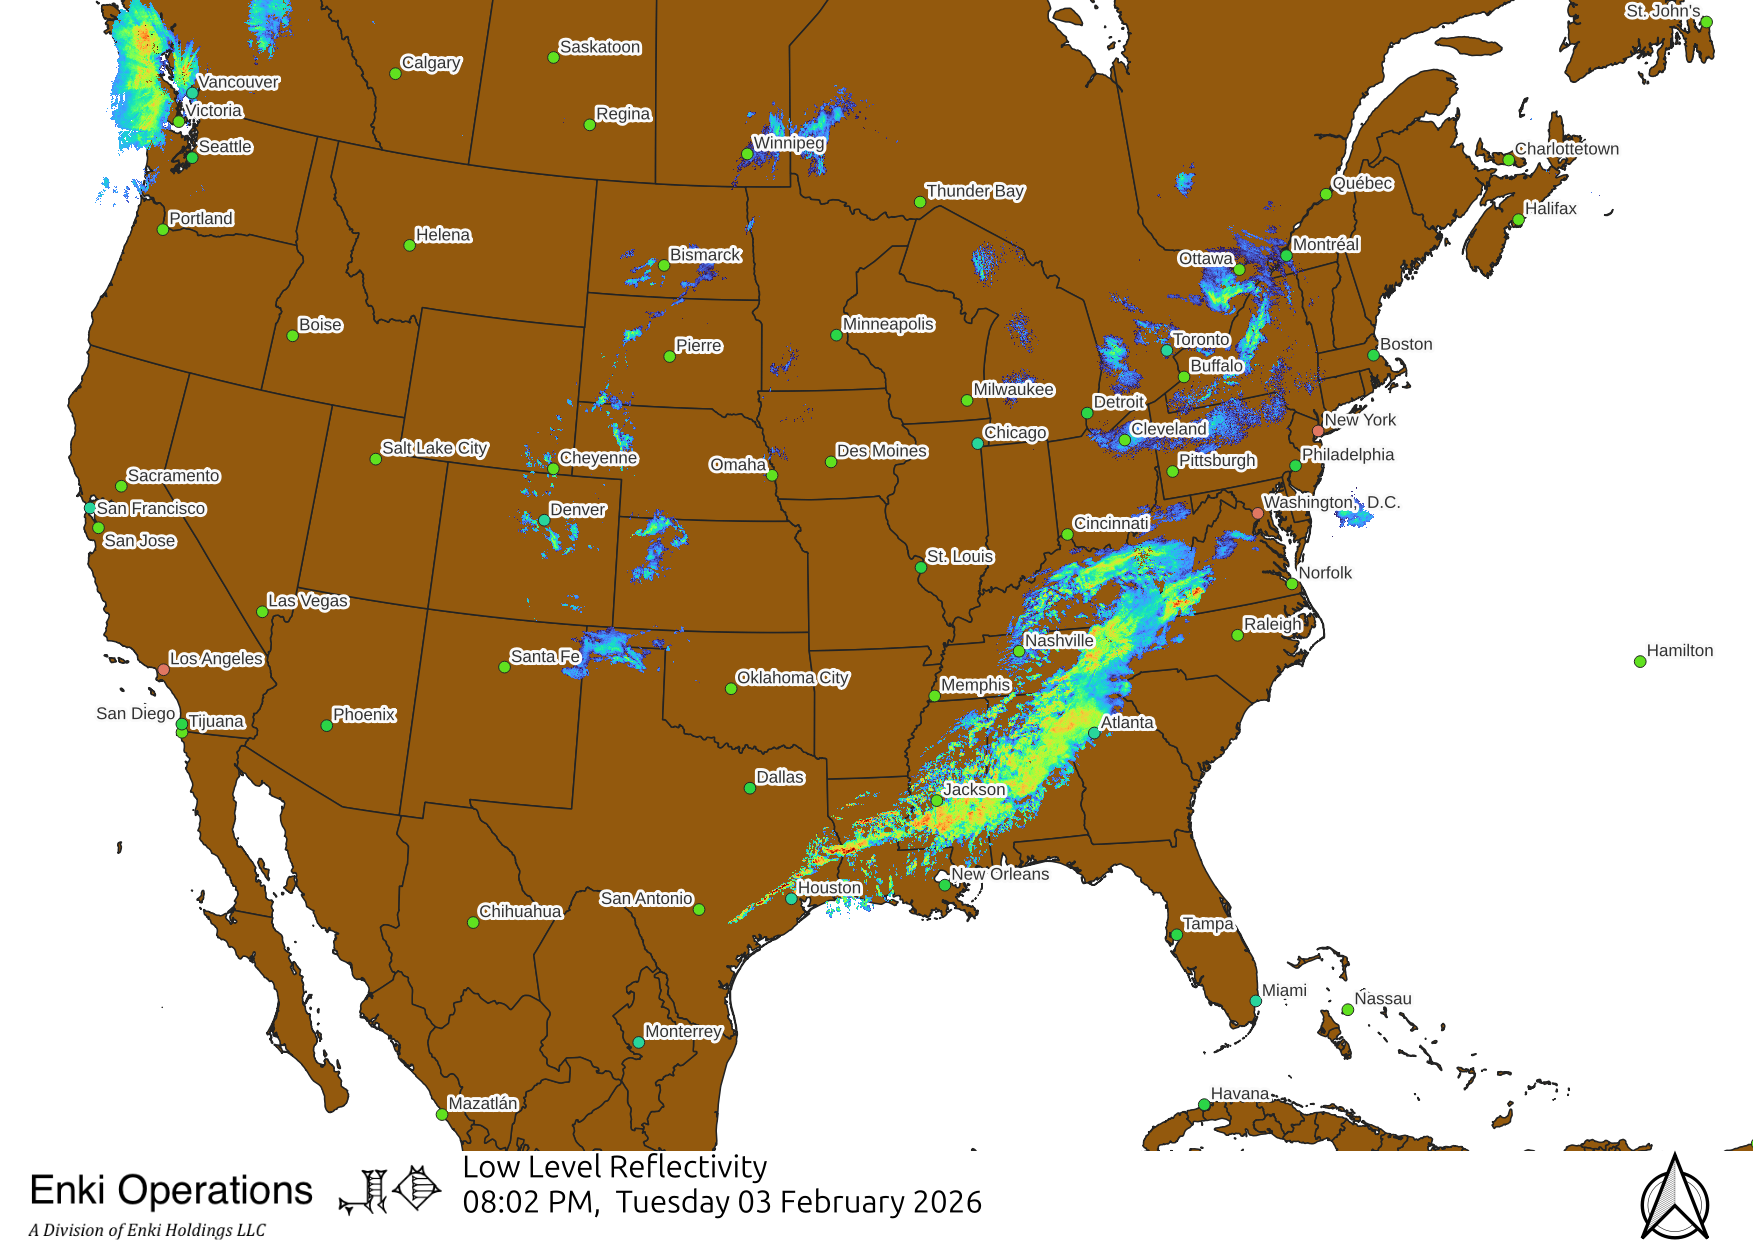
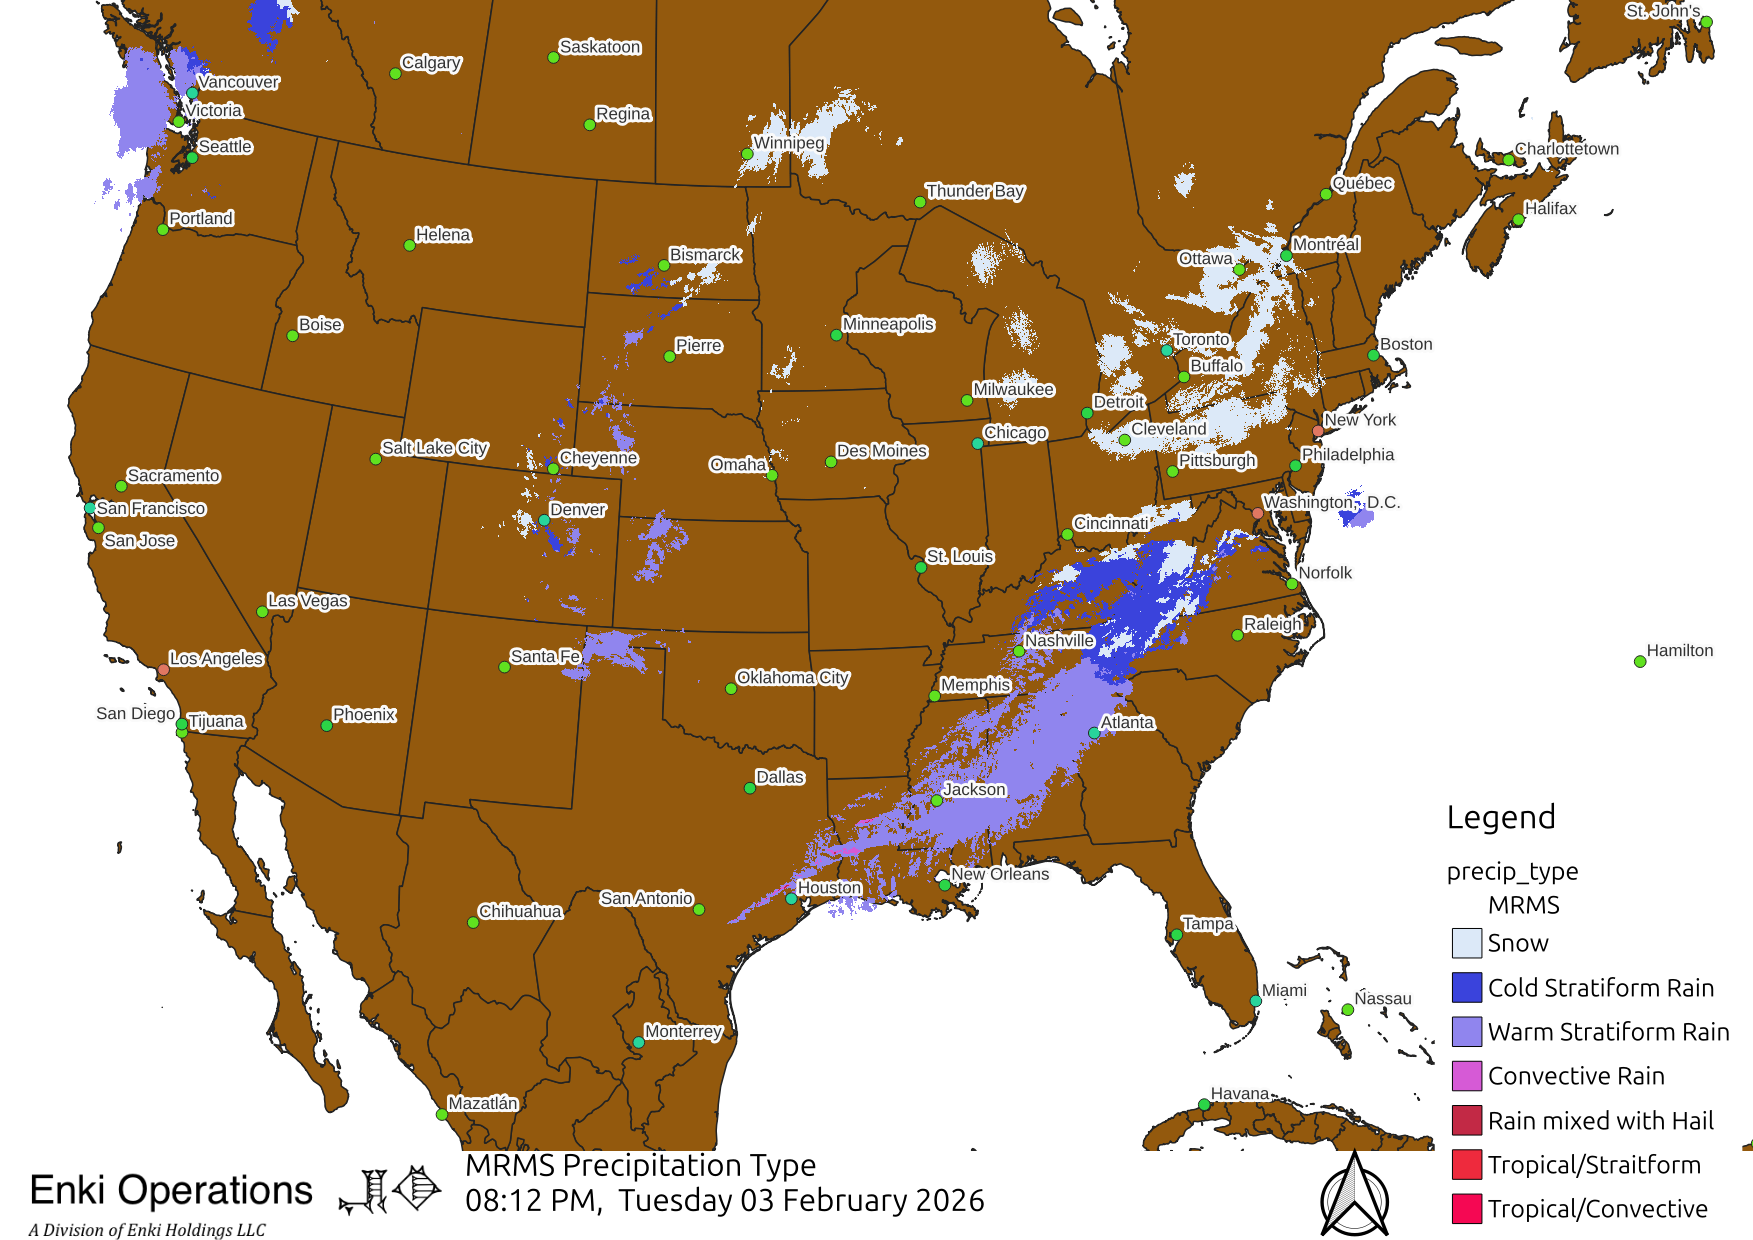
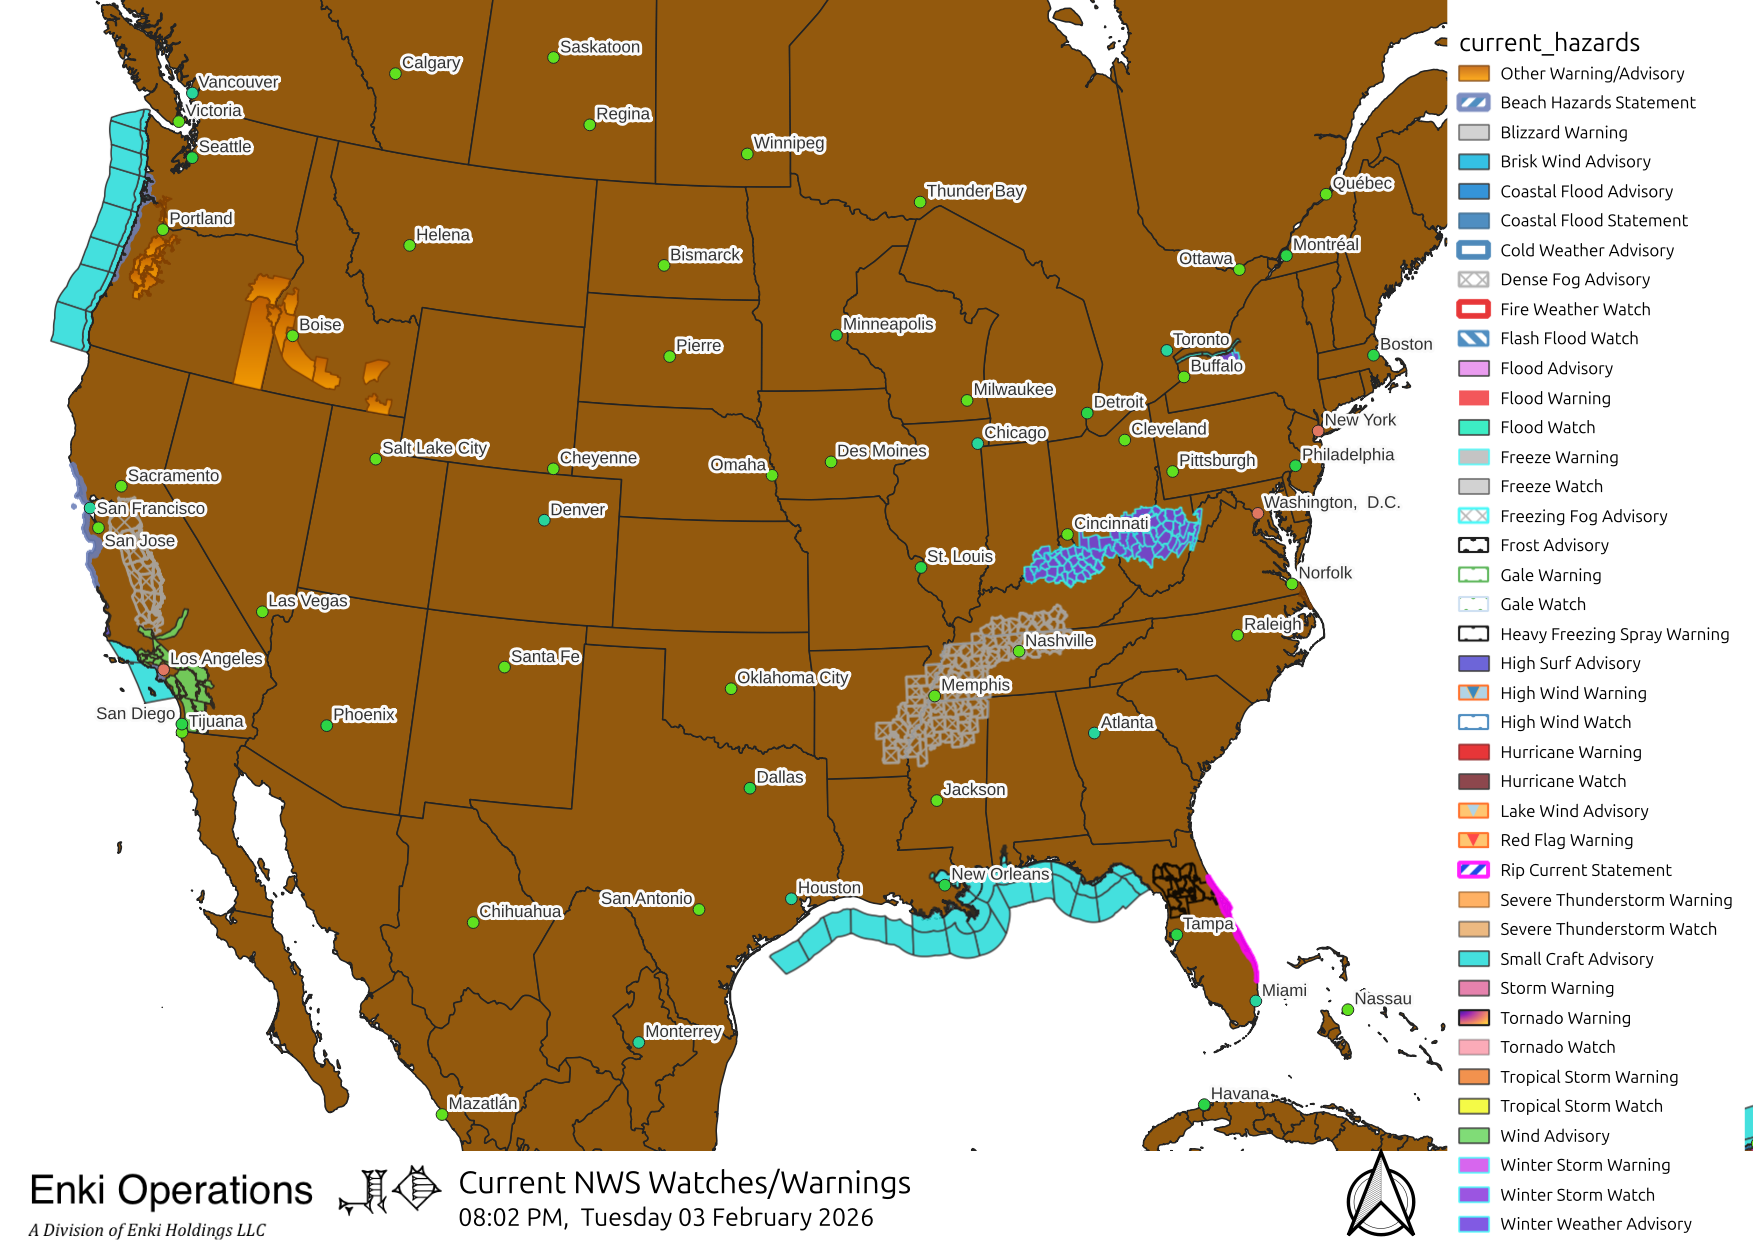
Somewhat fancier maps using QGIS, along with national watch/warning/advisory map.
| Reflectivity | Precipitation Type | Advisory/Watch/Warning map |
|---|---|---|
 |
 |
 |
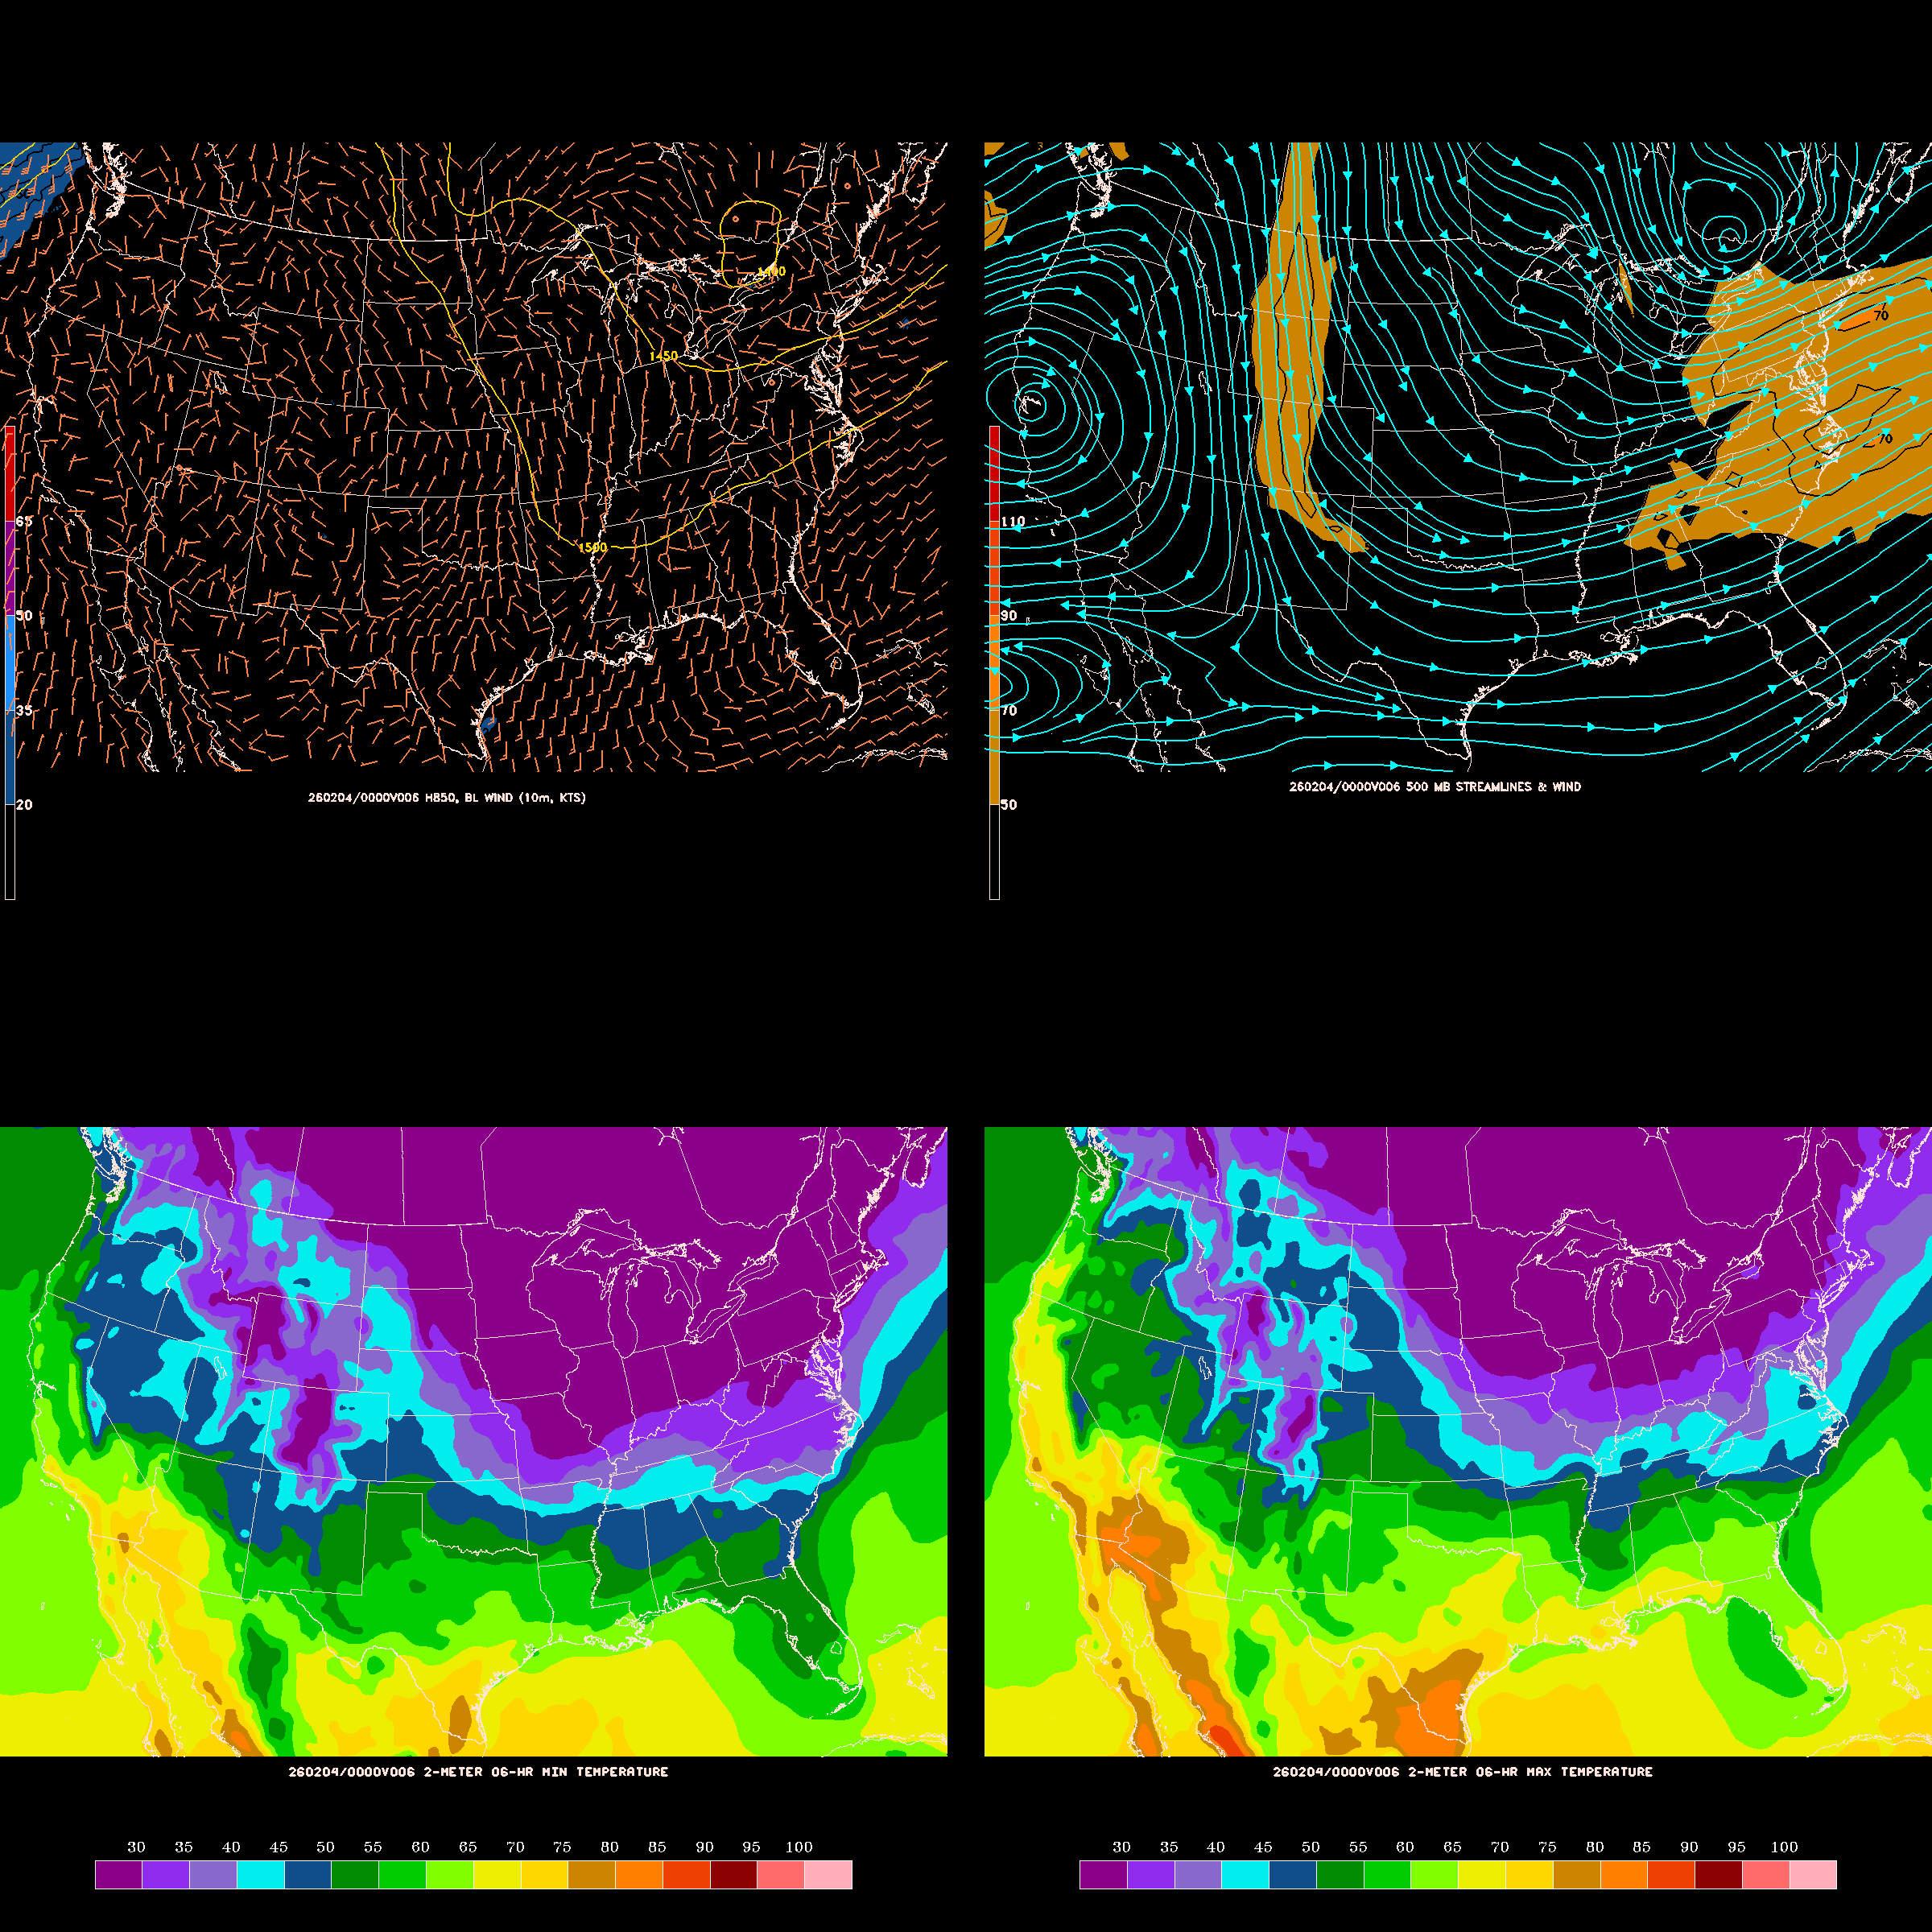
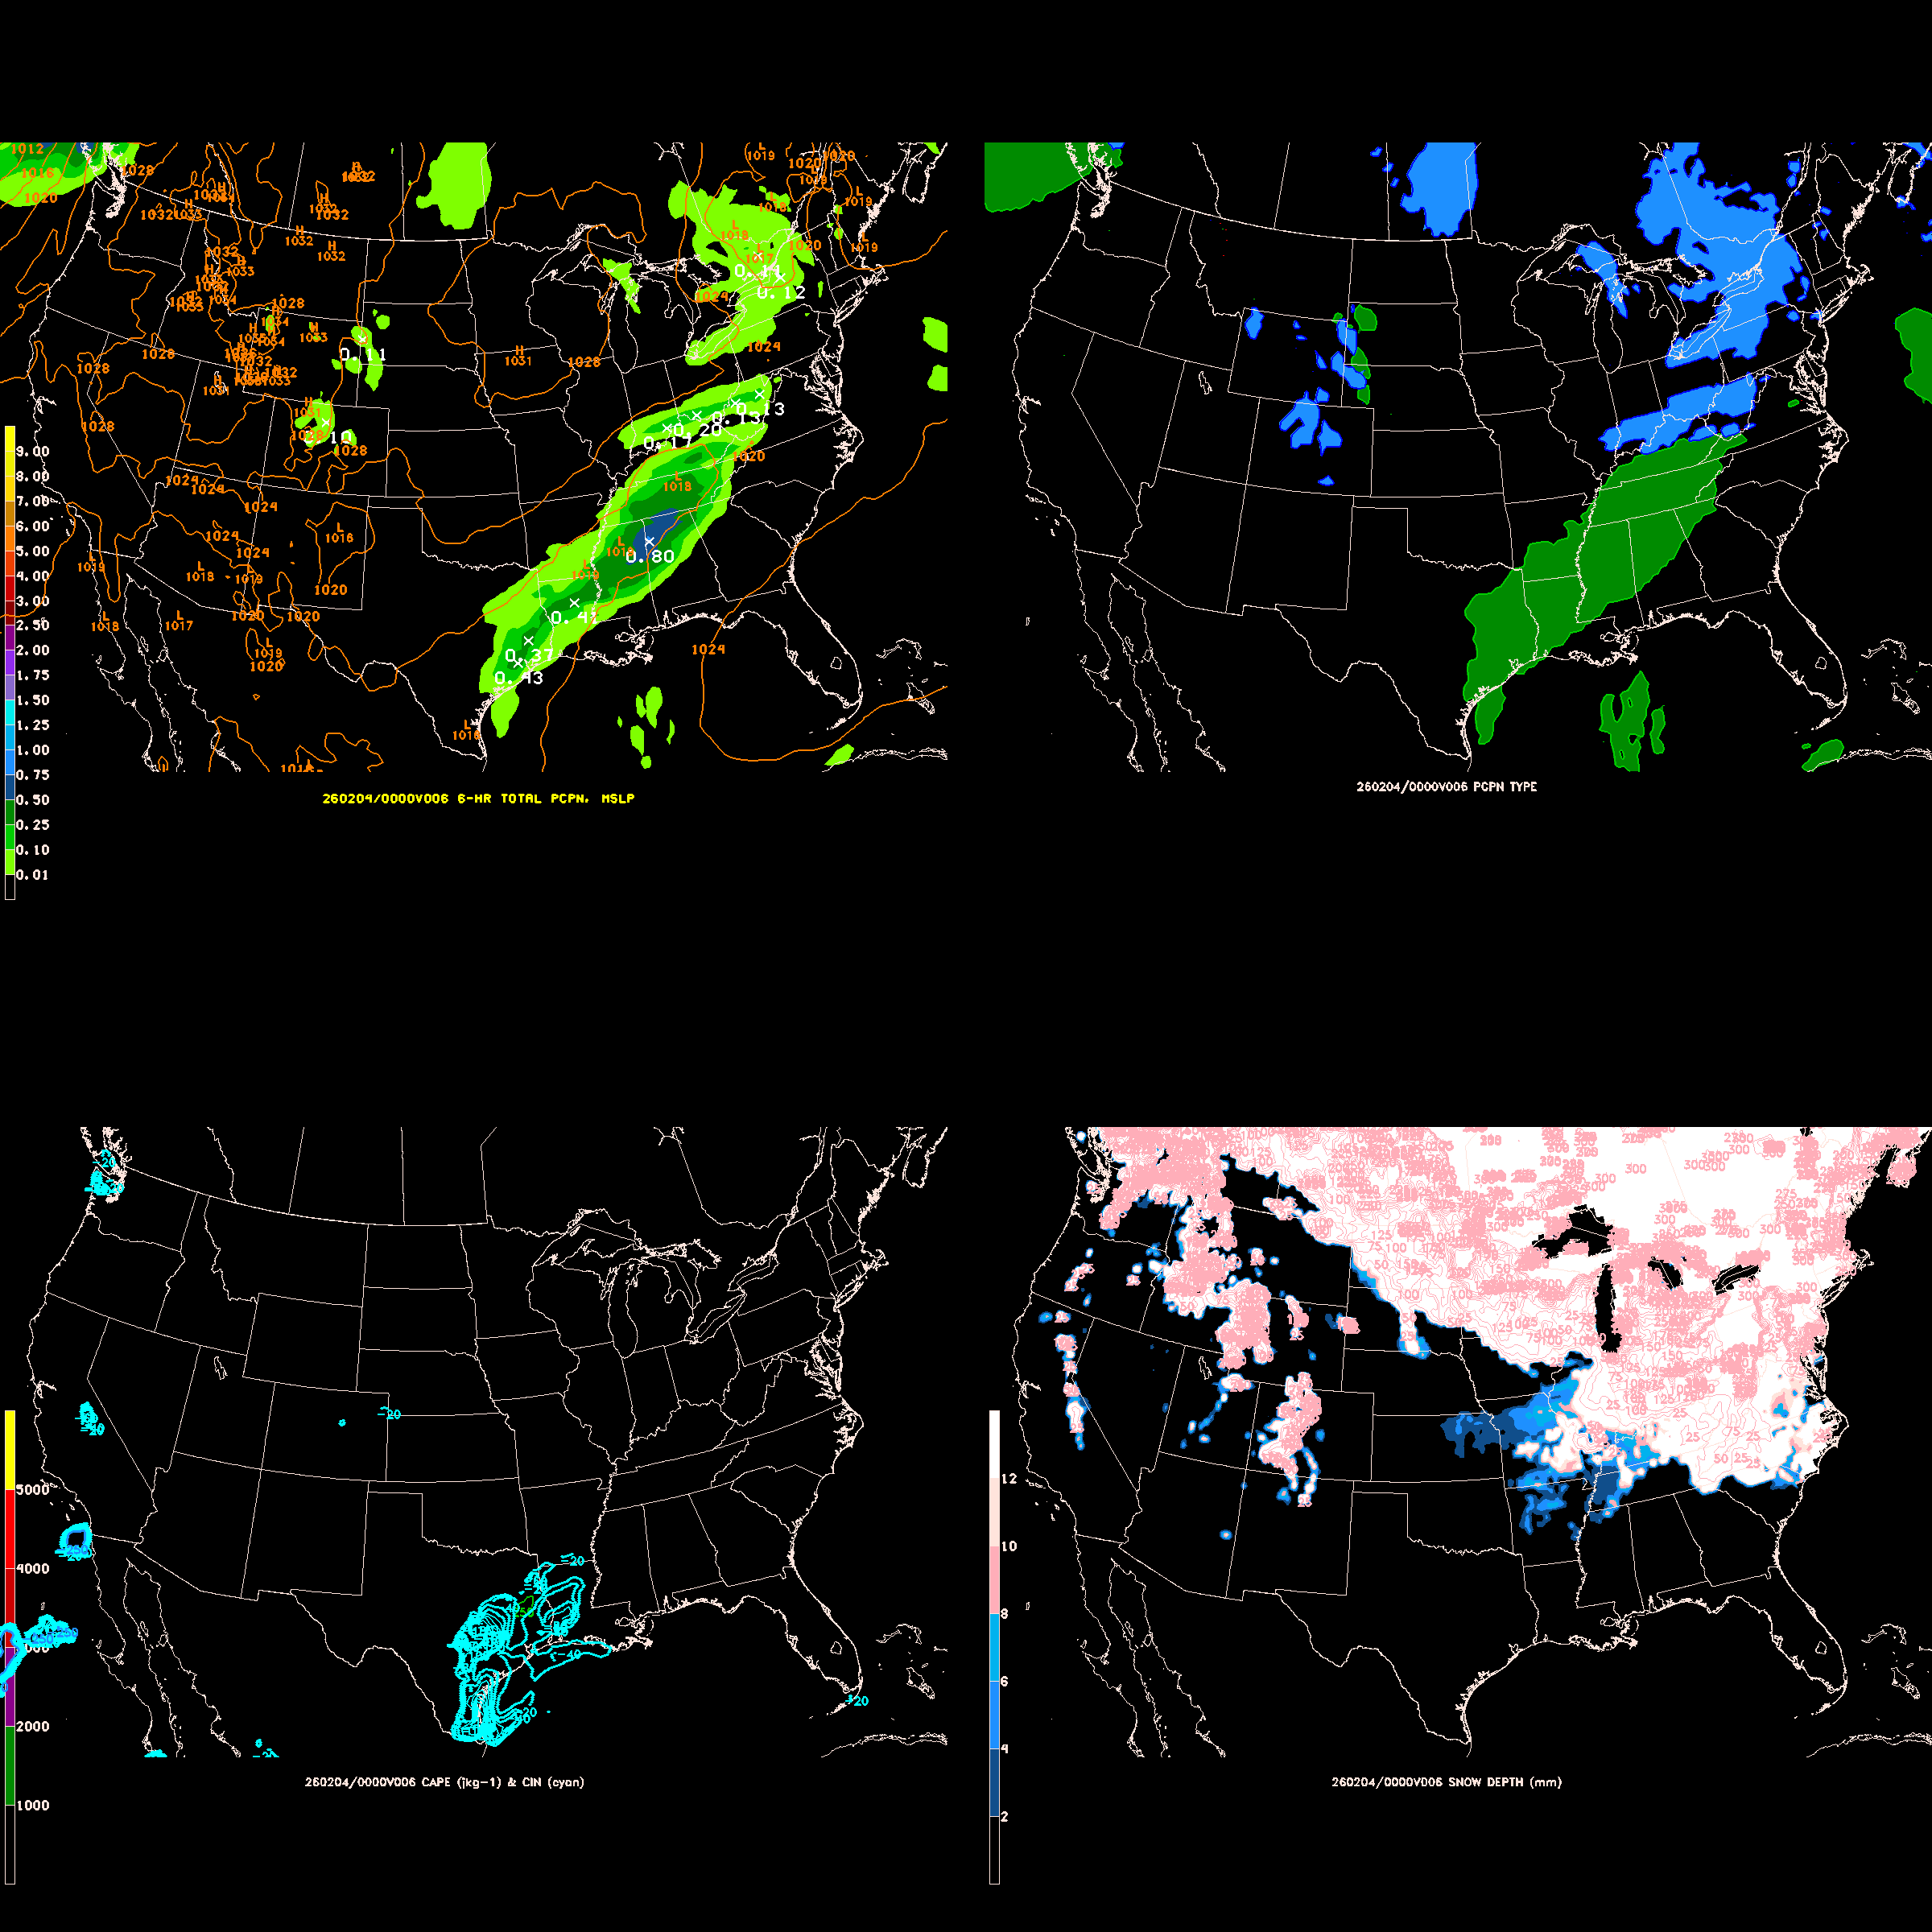
These charts show four variables on a single plot. The first set shows winds at the surface and middle atmophsere along with high and low temperatures in each six hour period. The second set shows information about precipitation and severe weather such as rainfall, precipitation type, CAPE (a measure of instability), and snow depth (in late fall/ winter) or rotation in the atmosphere (helicity, spring/summer/early fall).
|
|