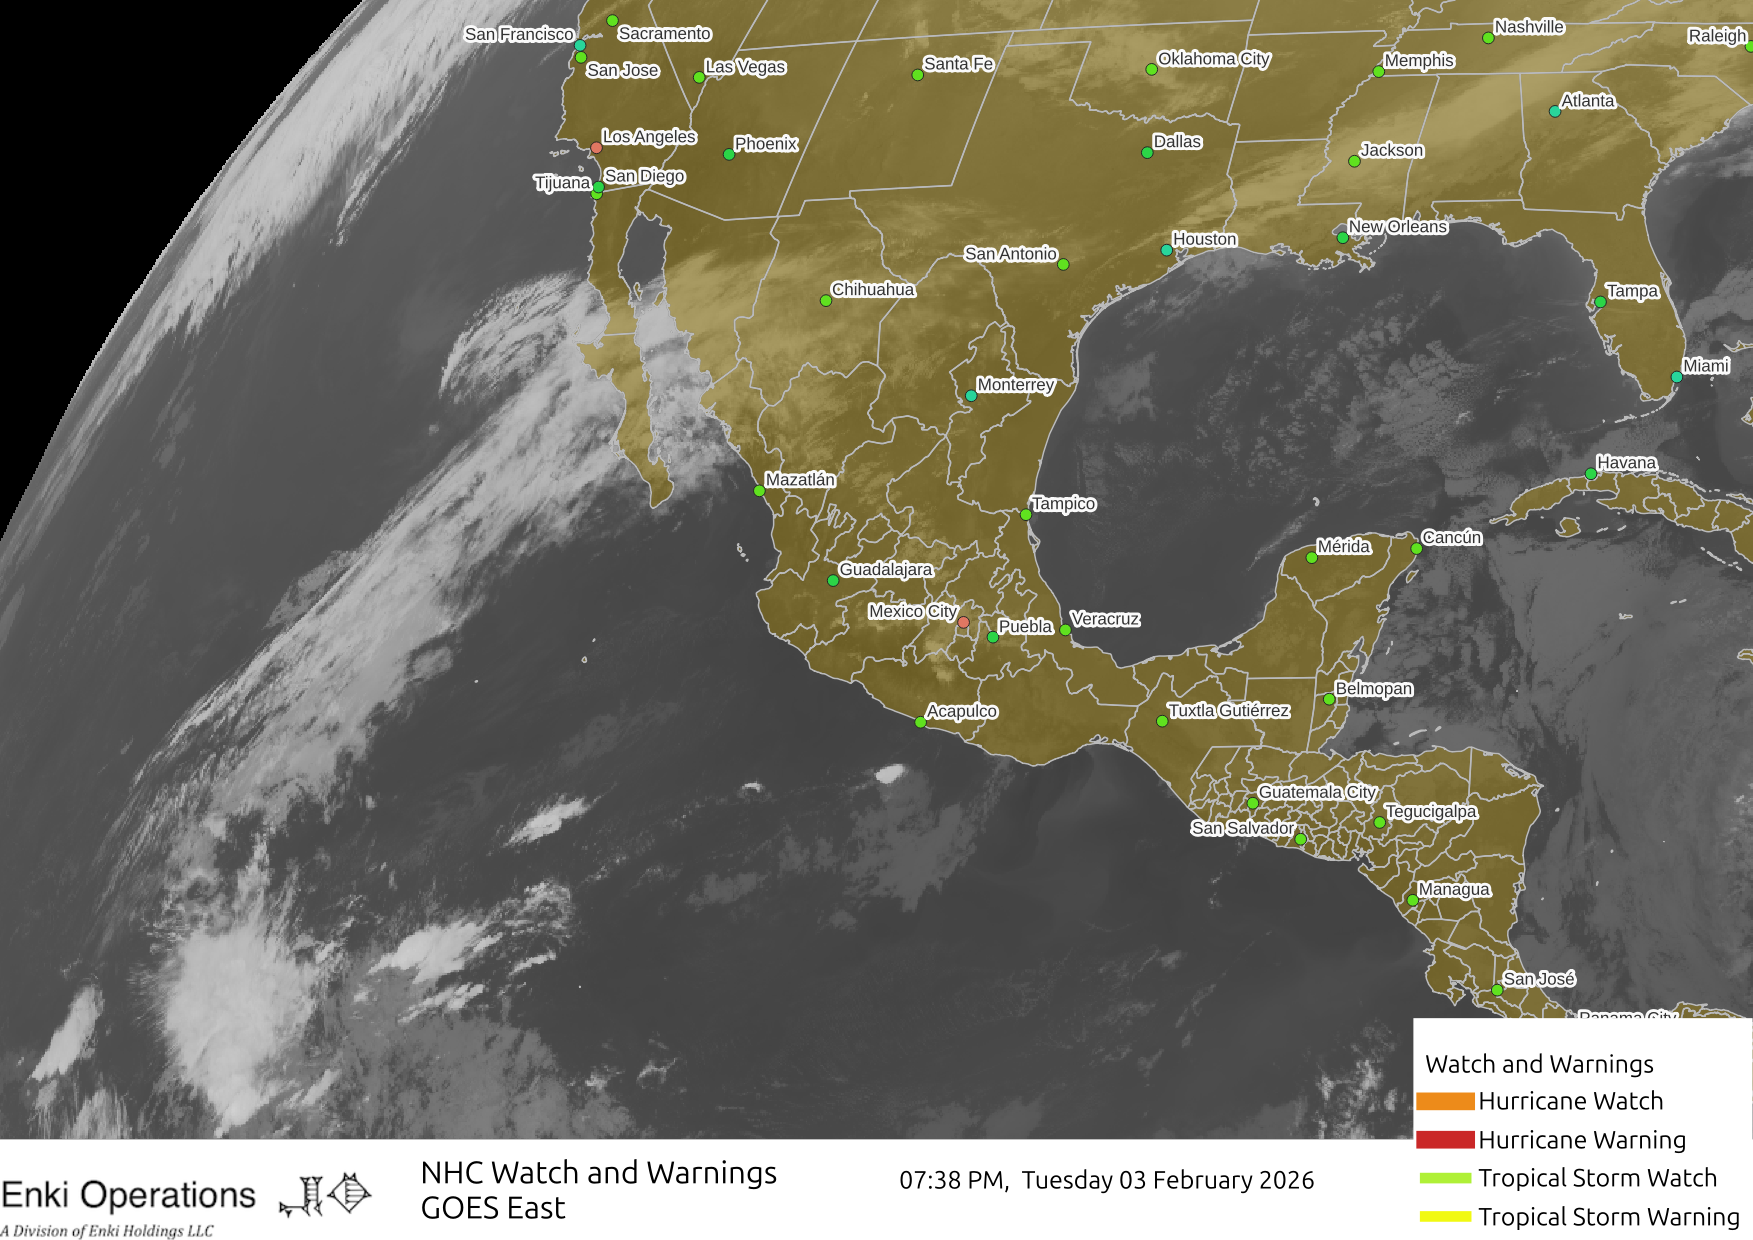
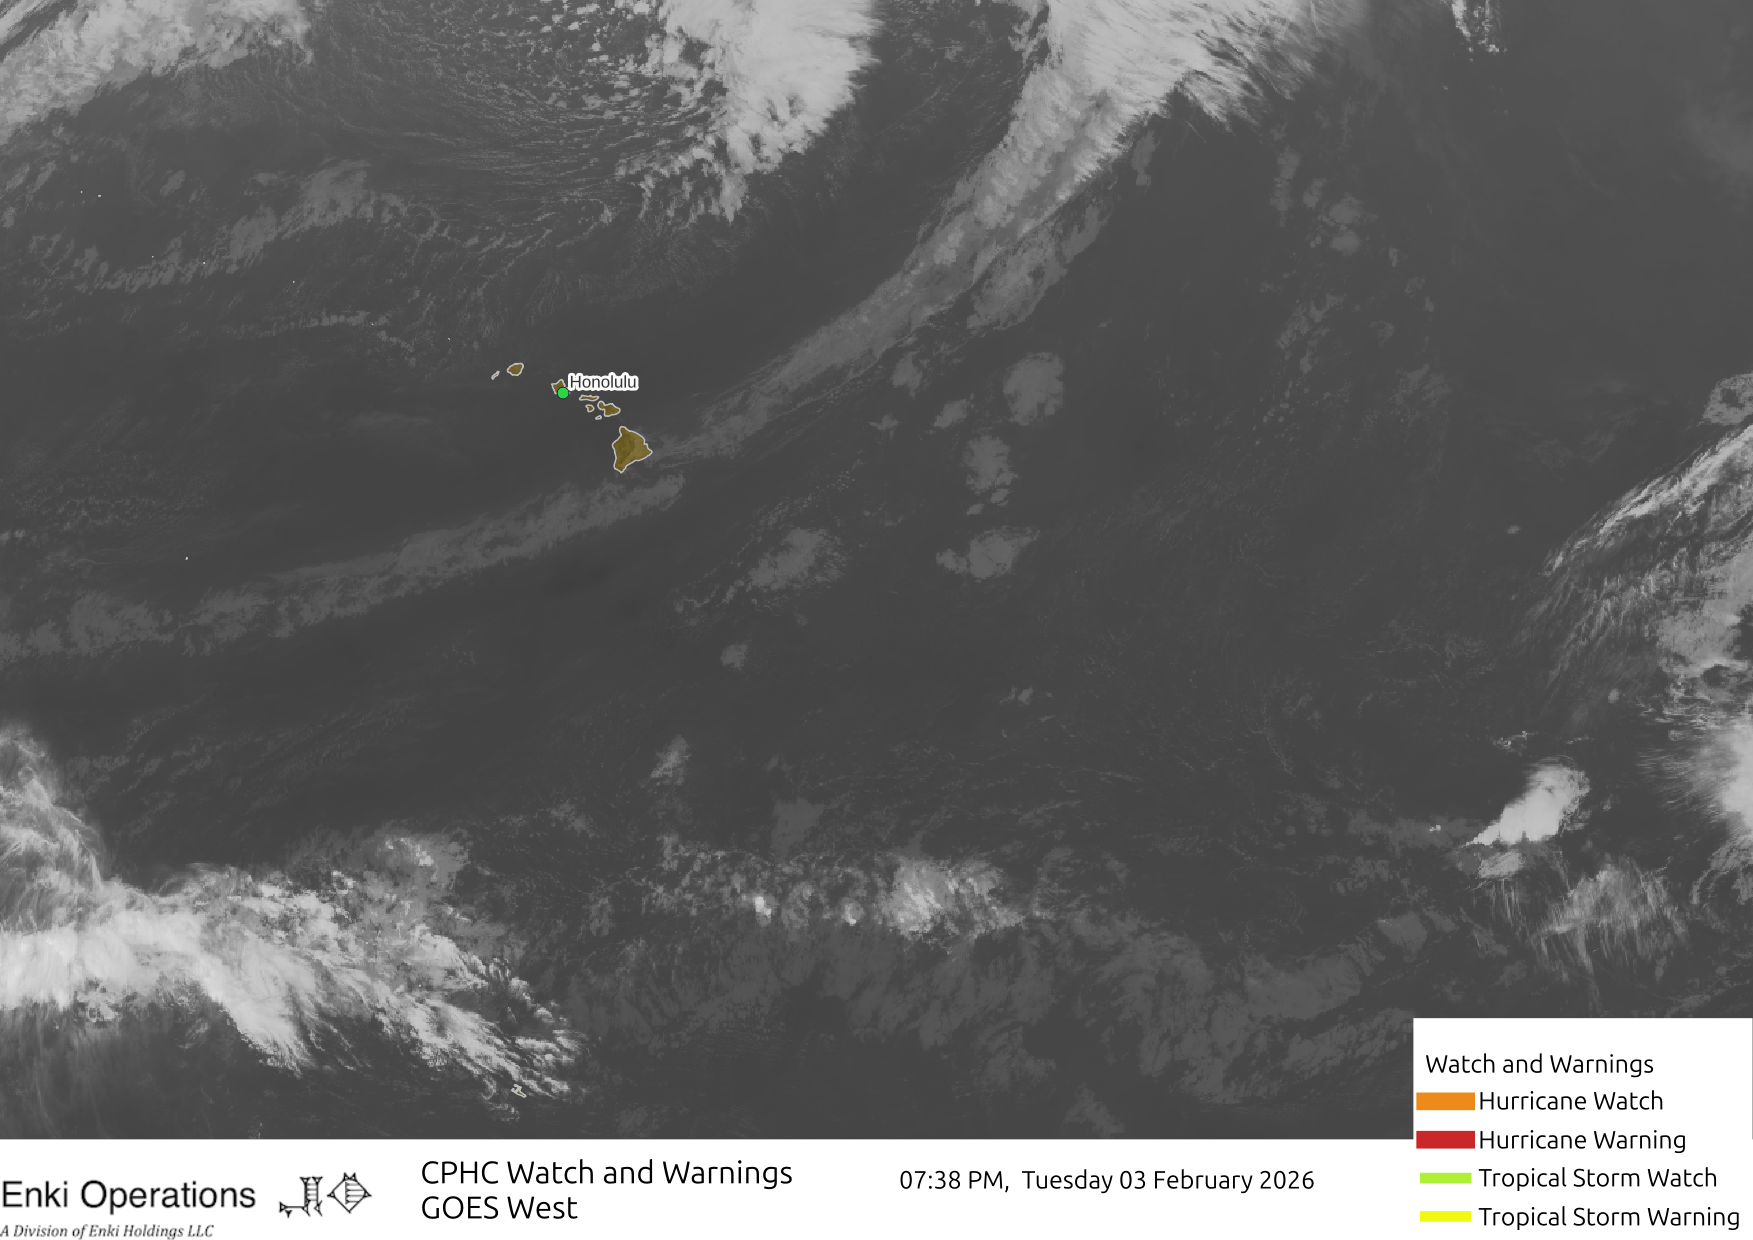
WARNING: Experimental data, do NOT use for decision making! Use data from your local weather service.
This page was generated at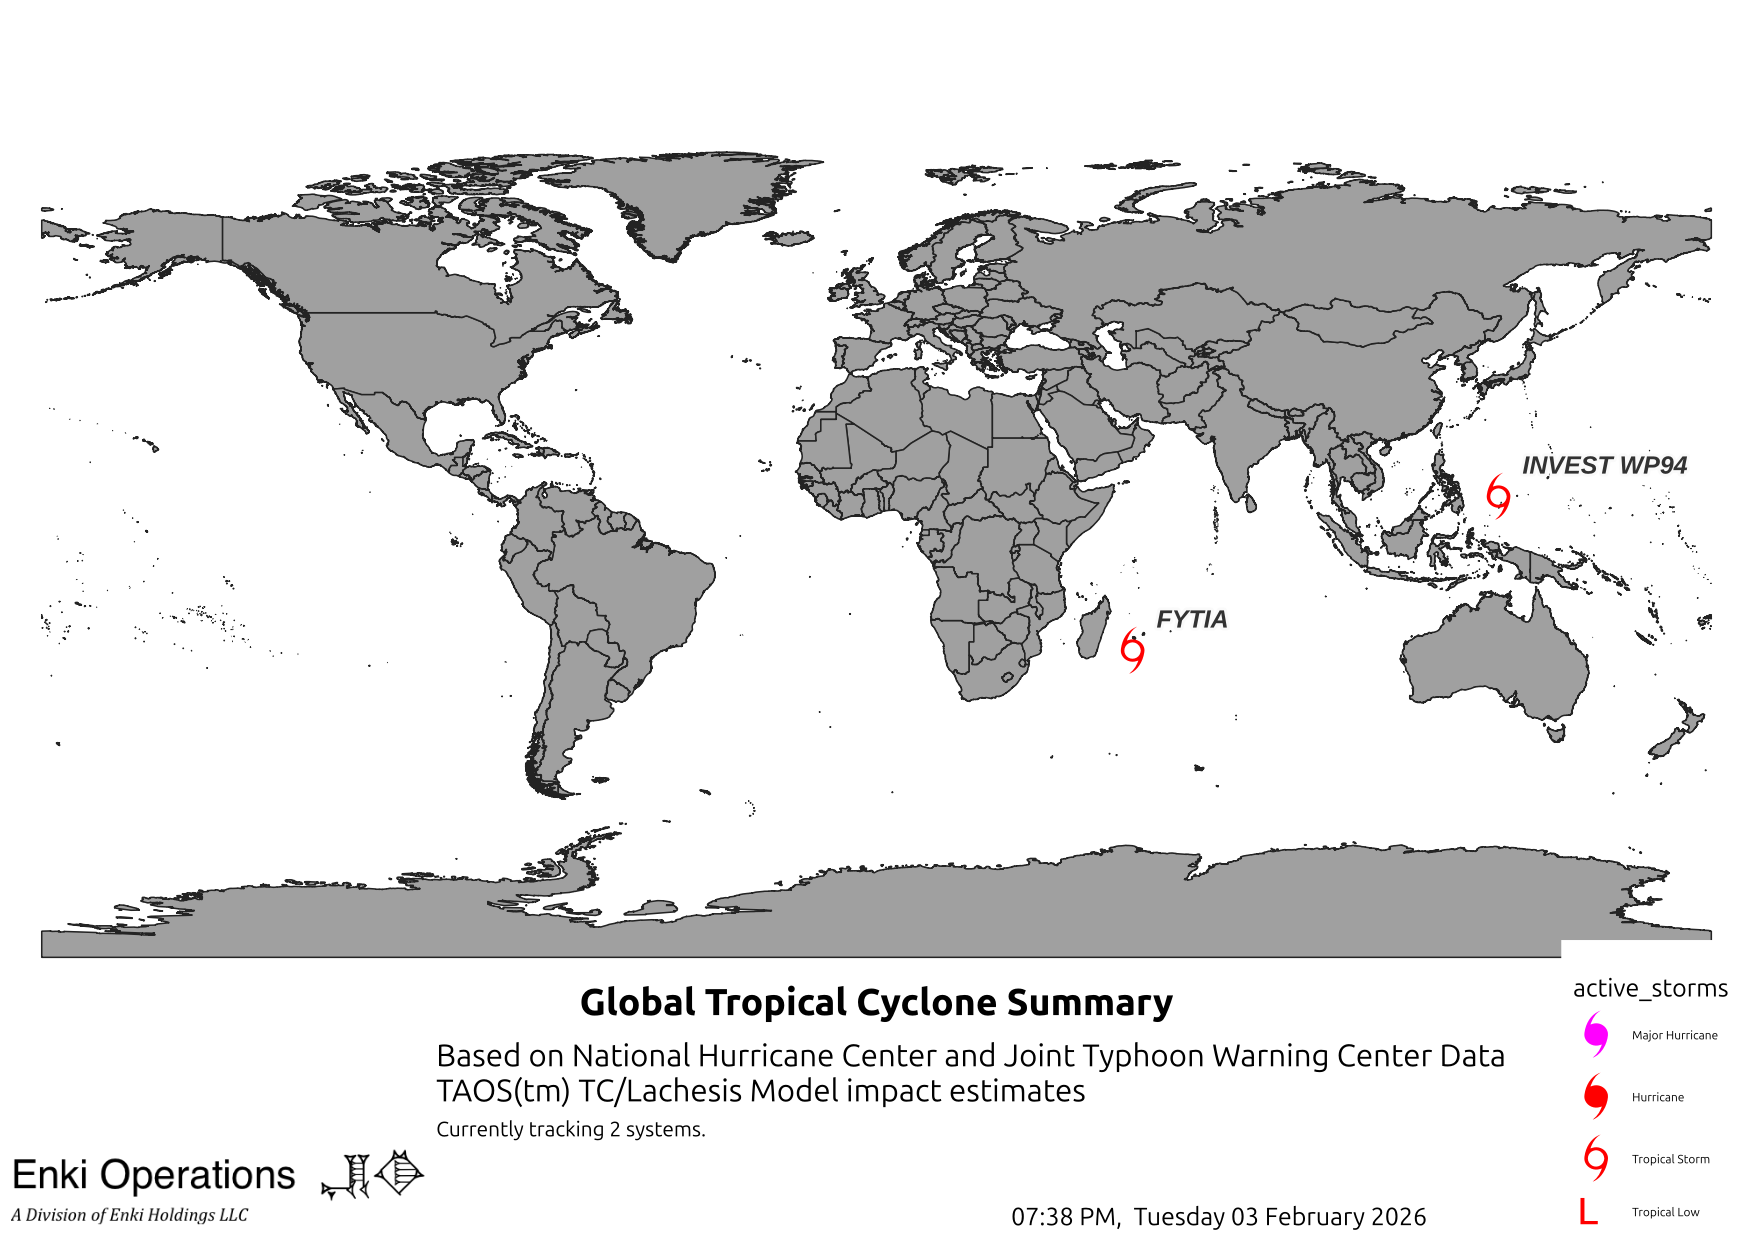
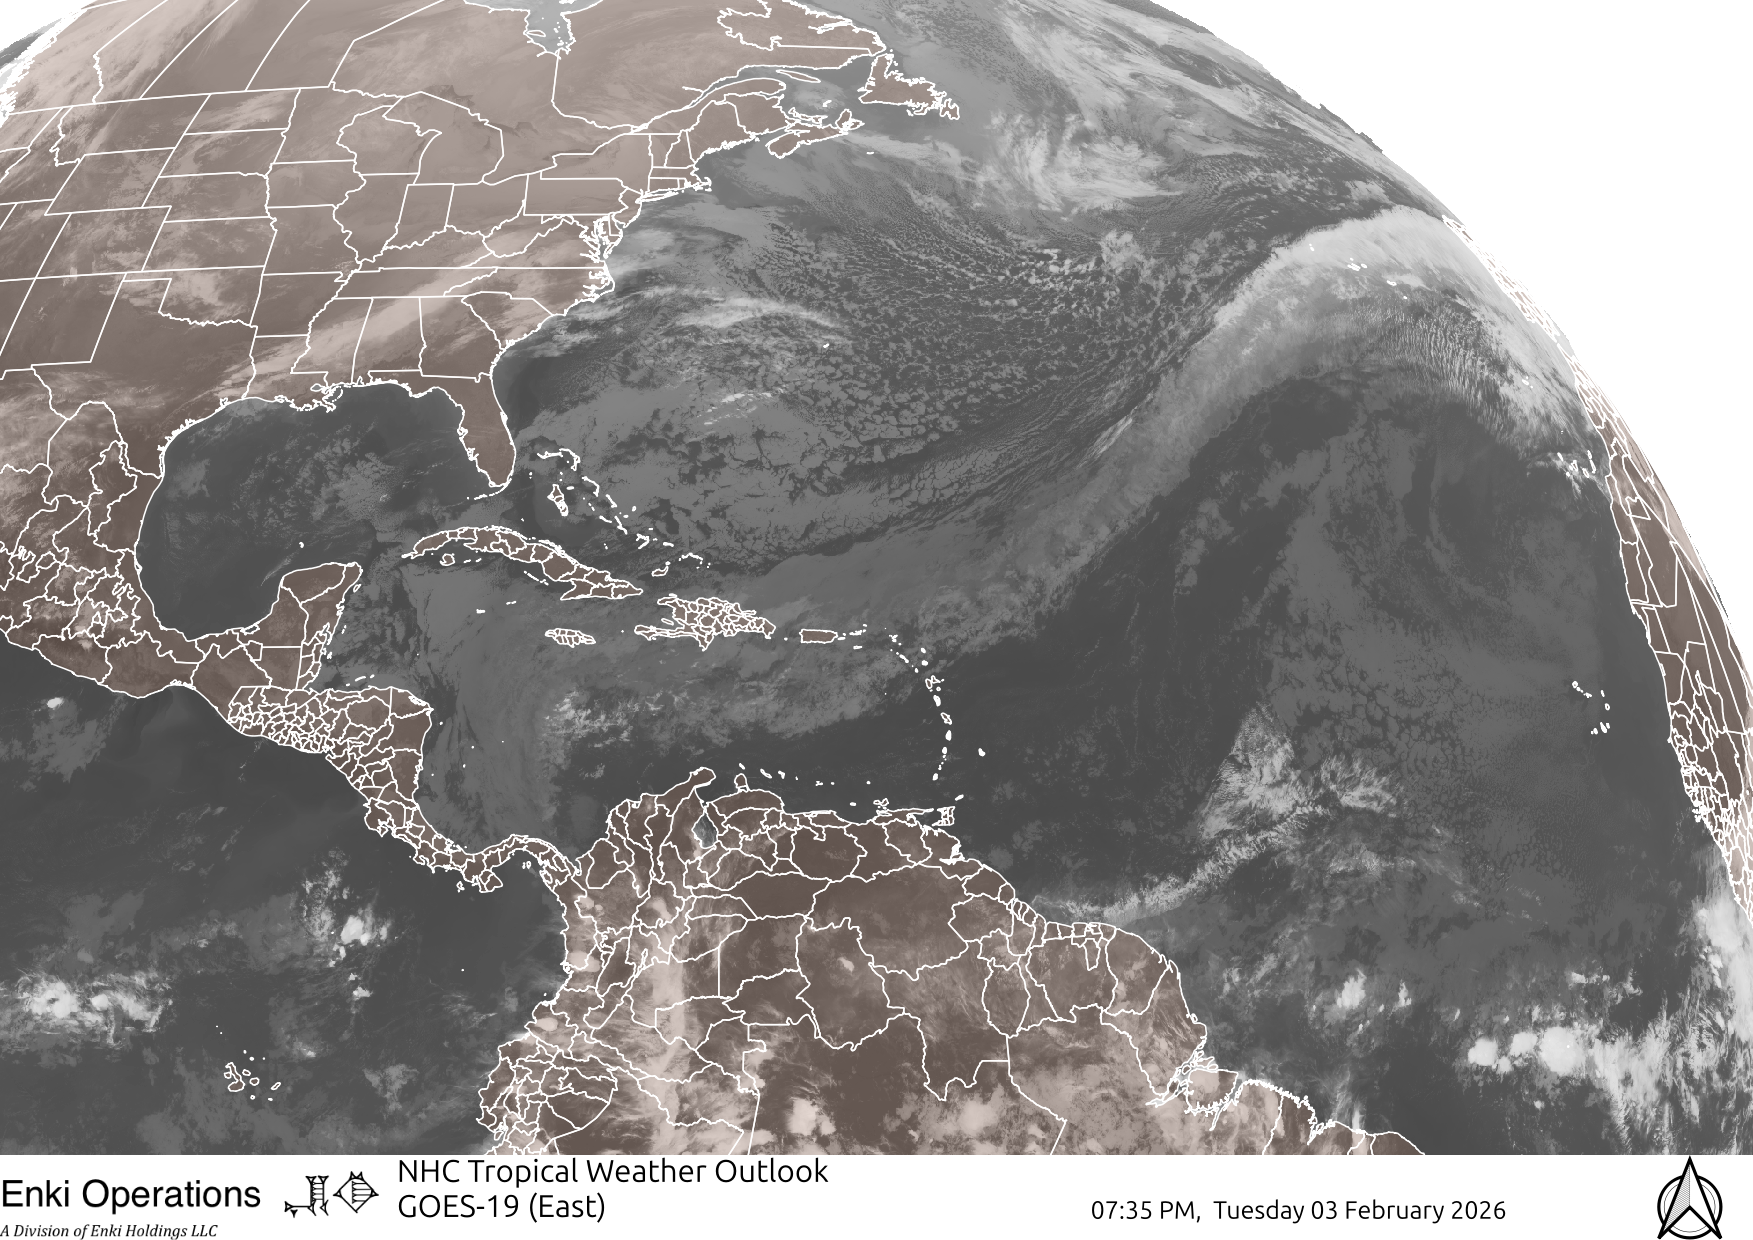
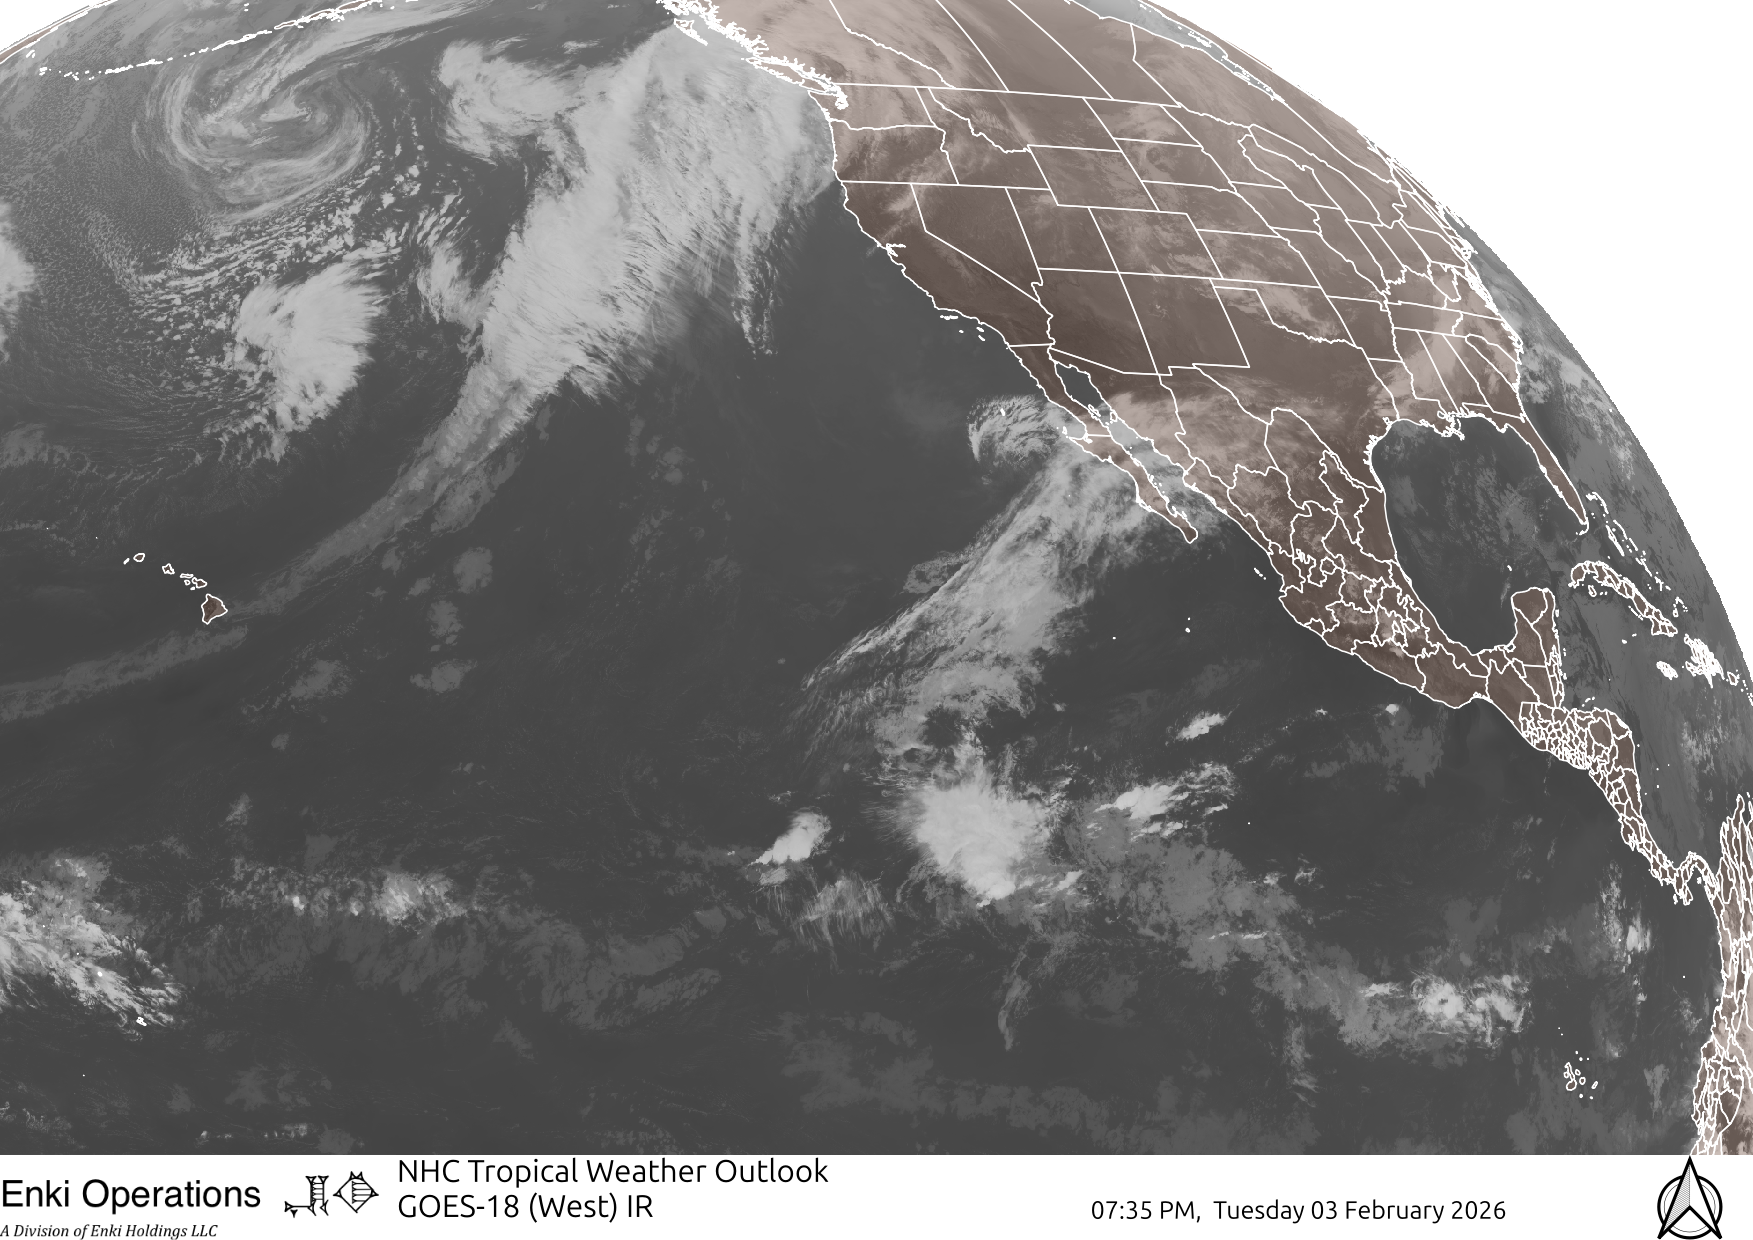
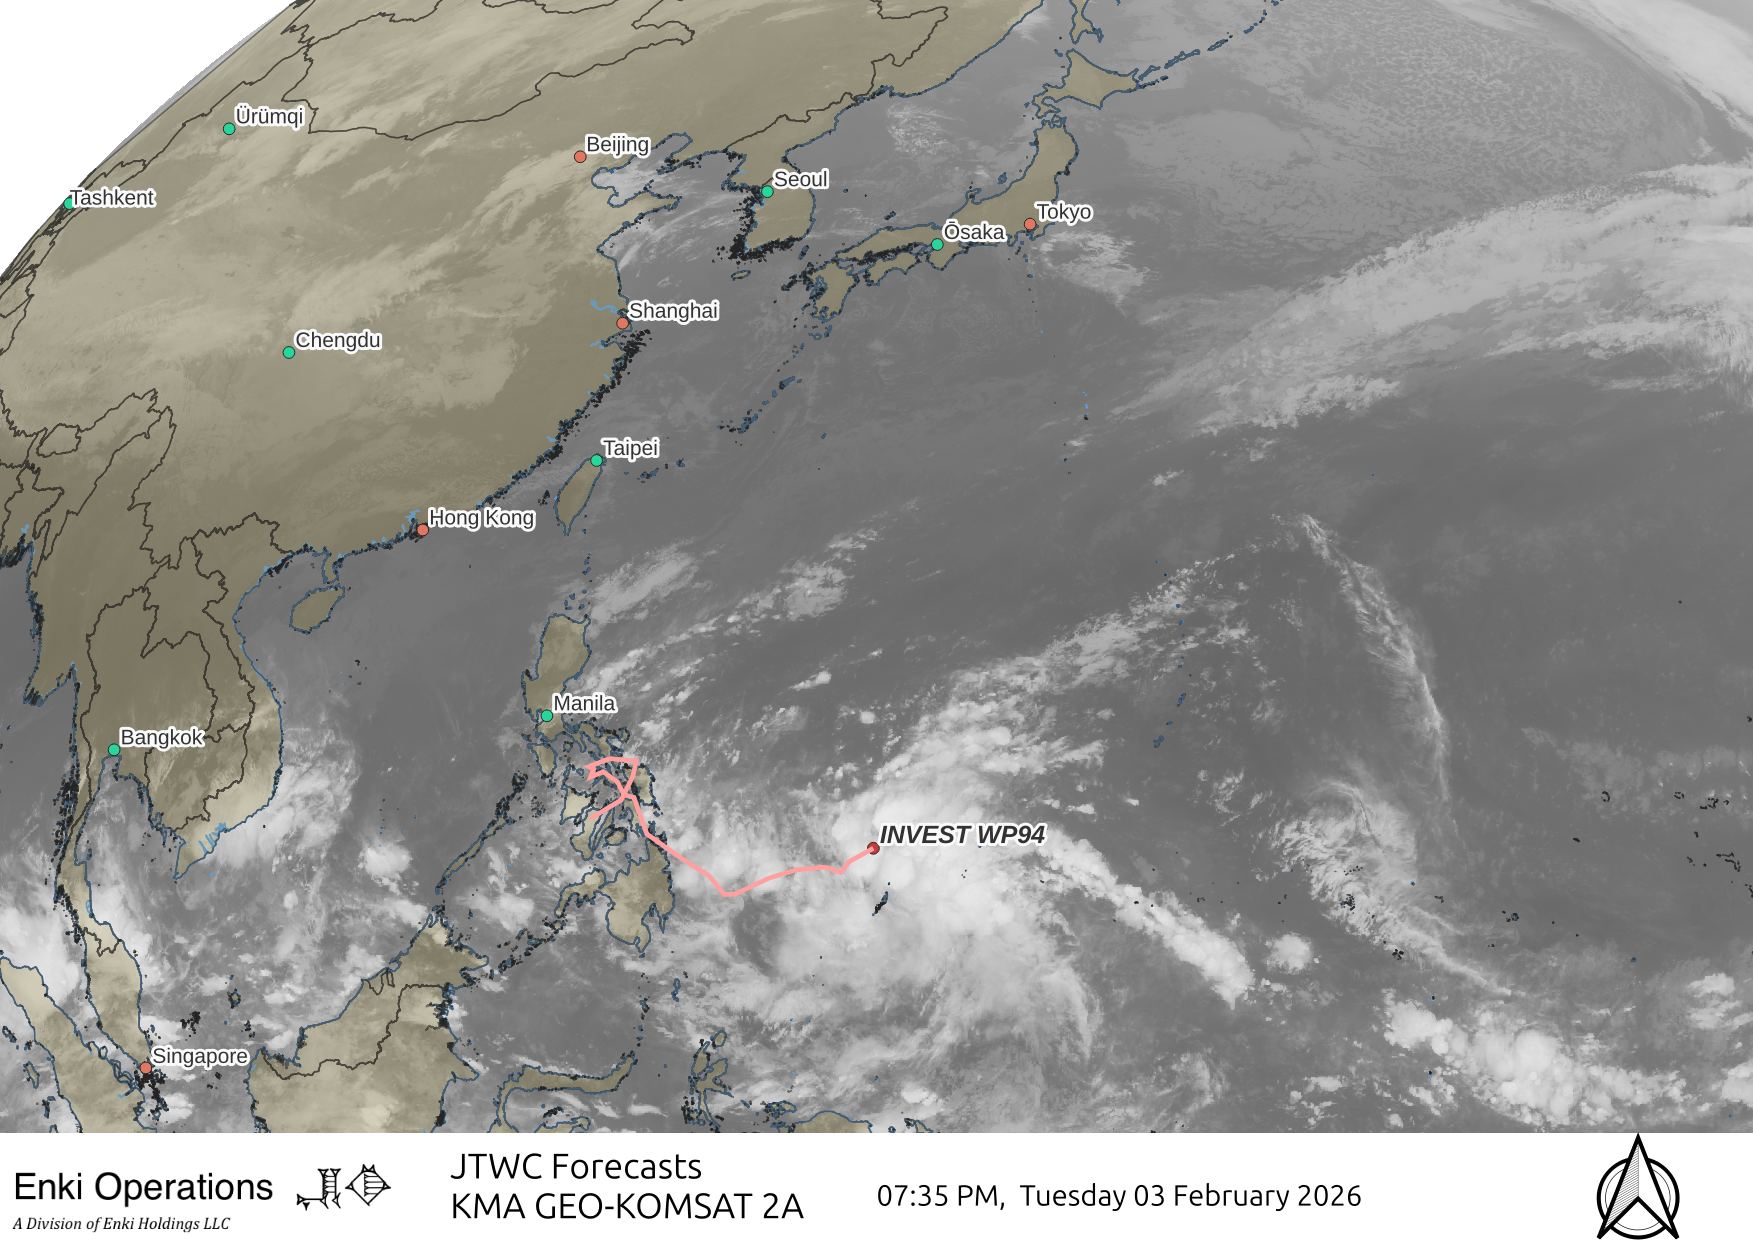
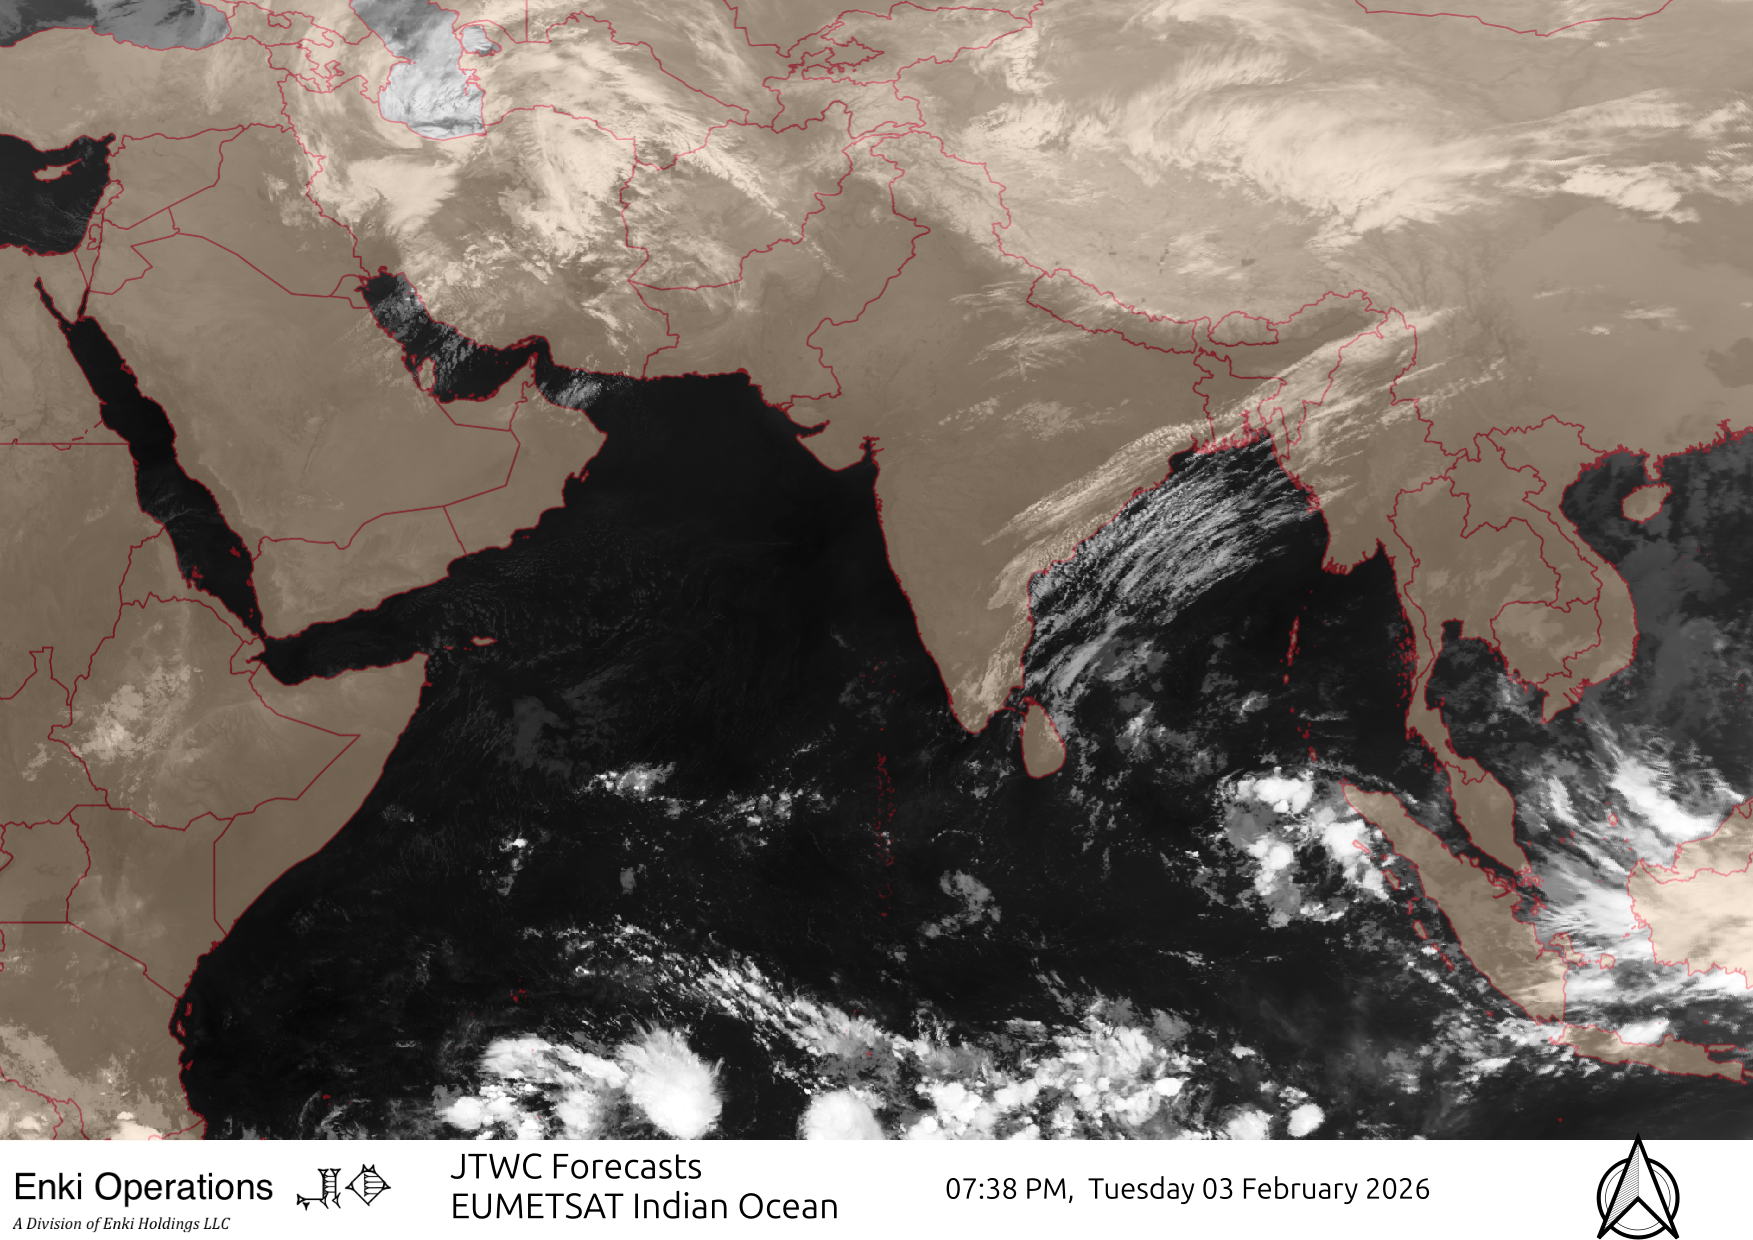
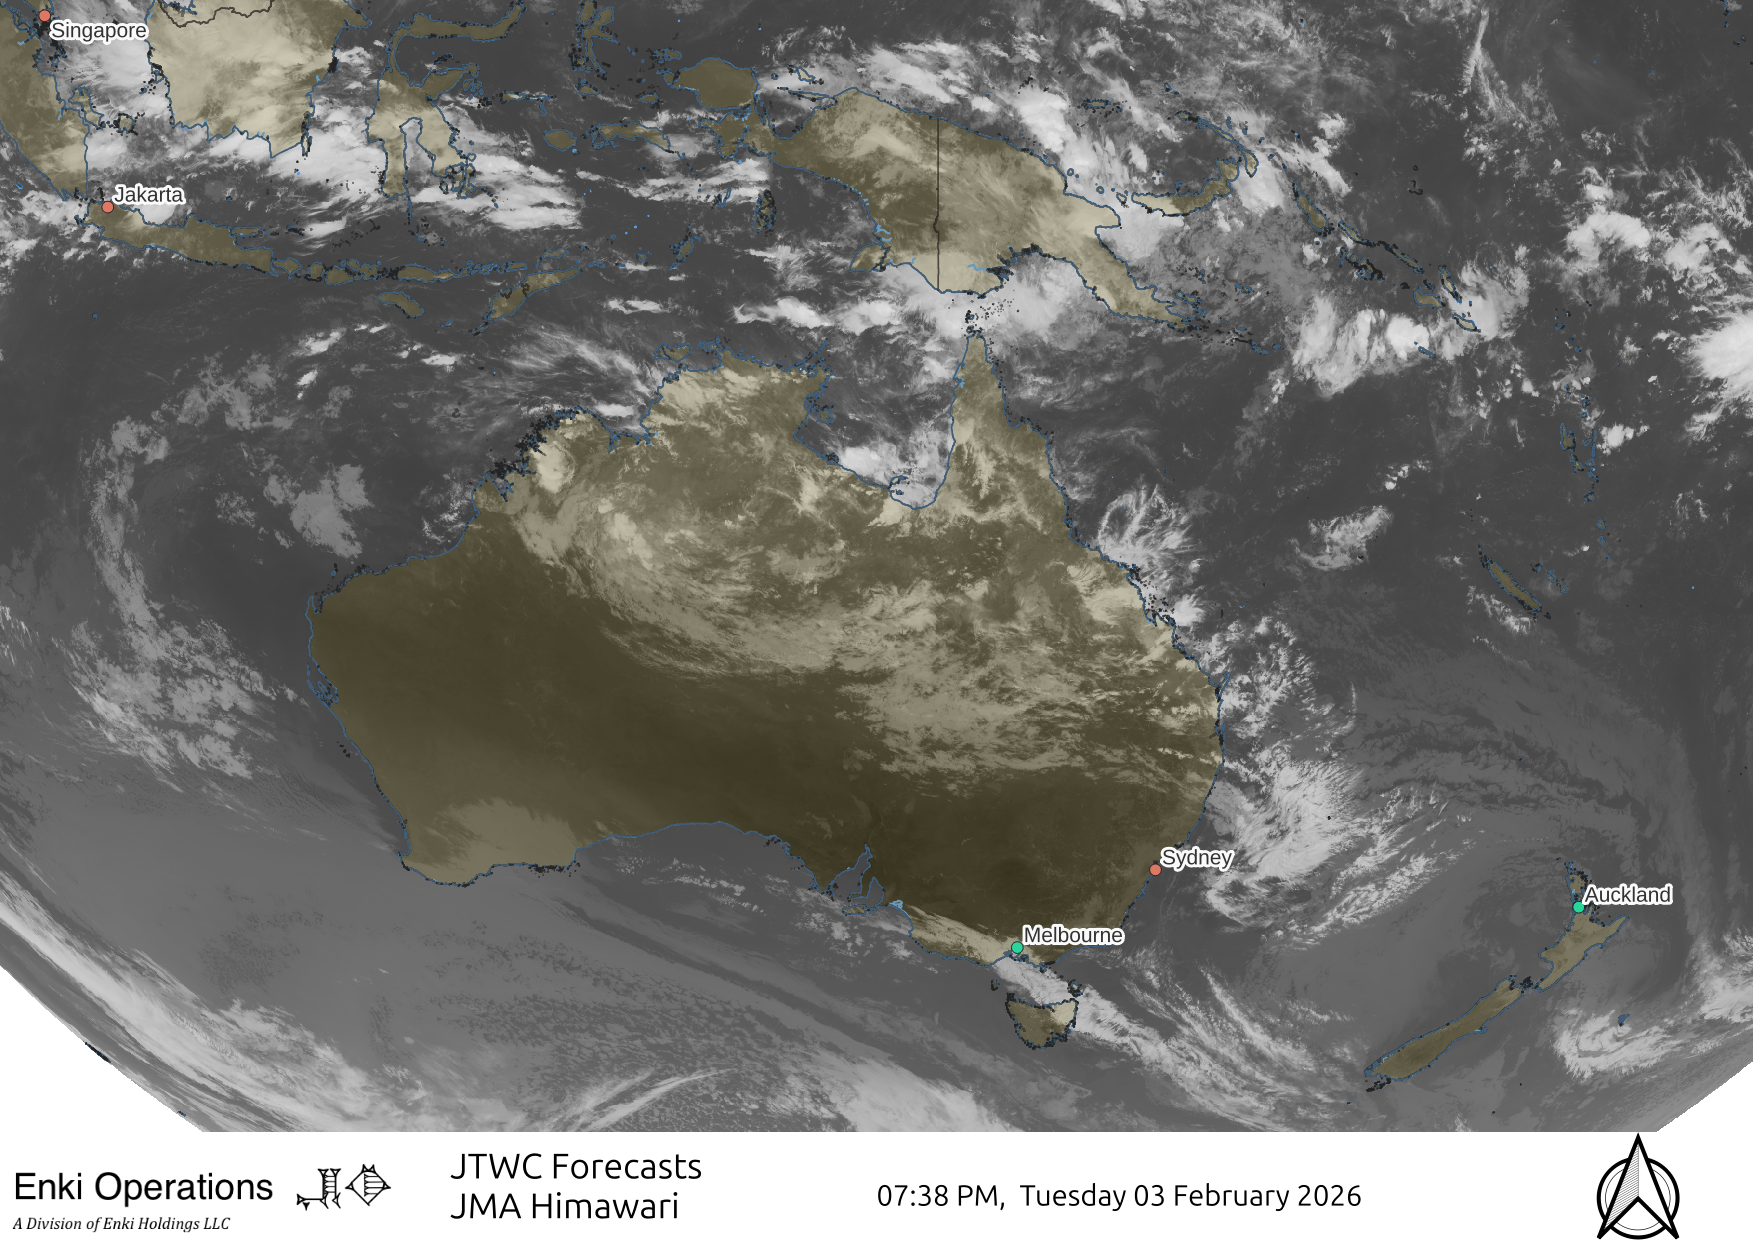
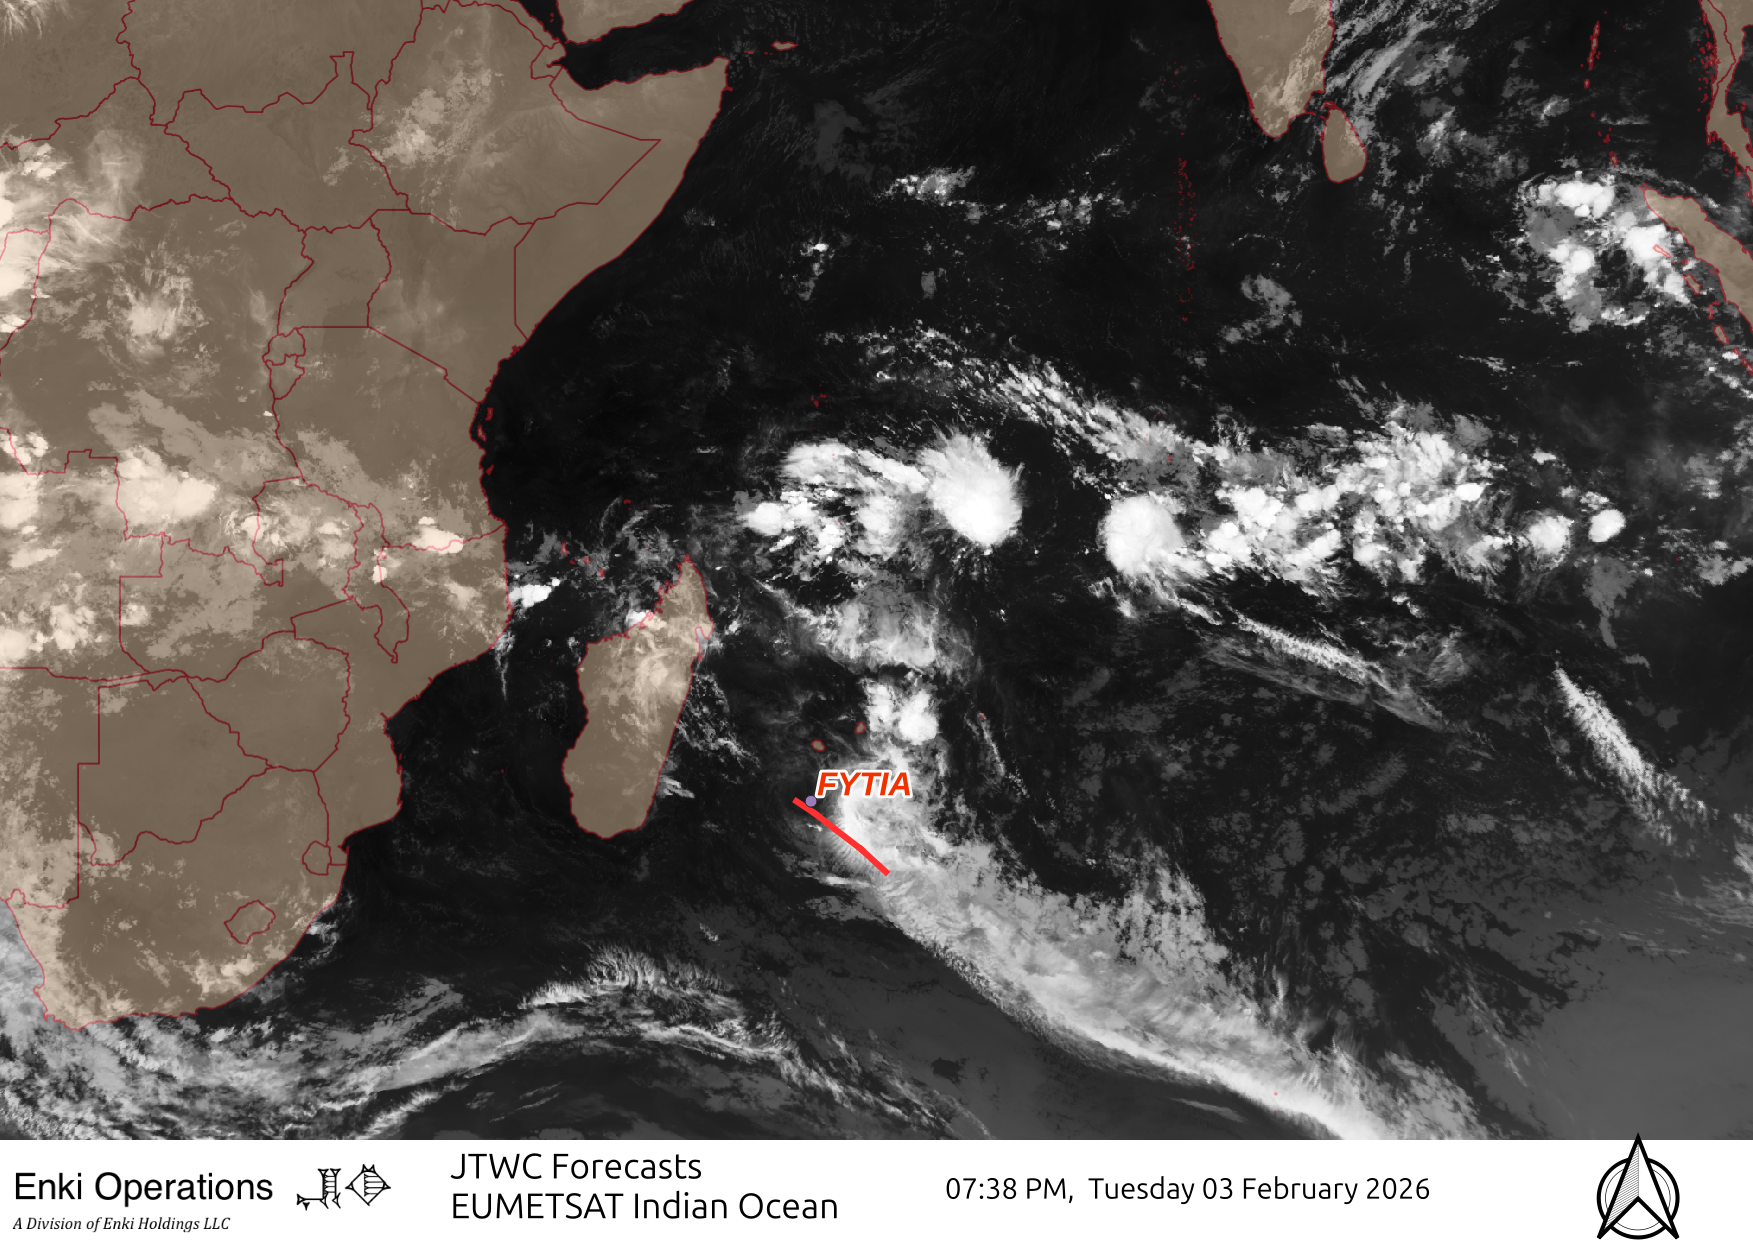
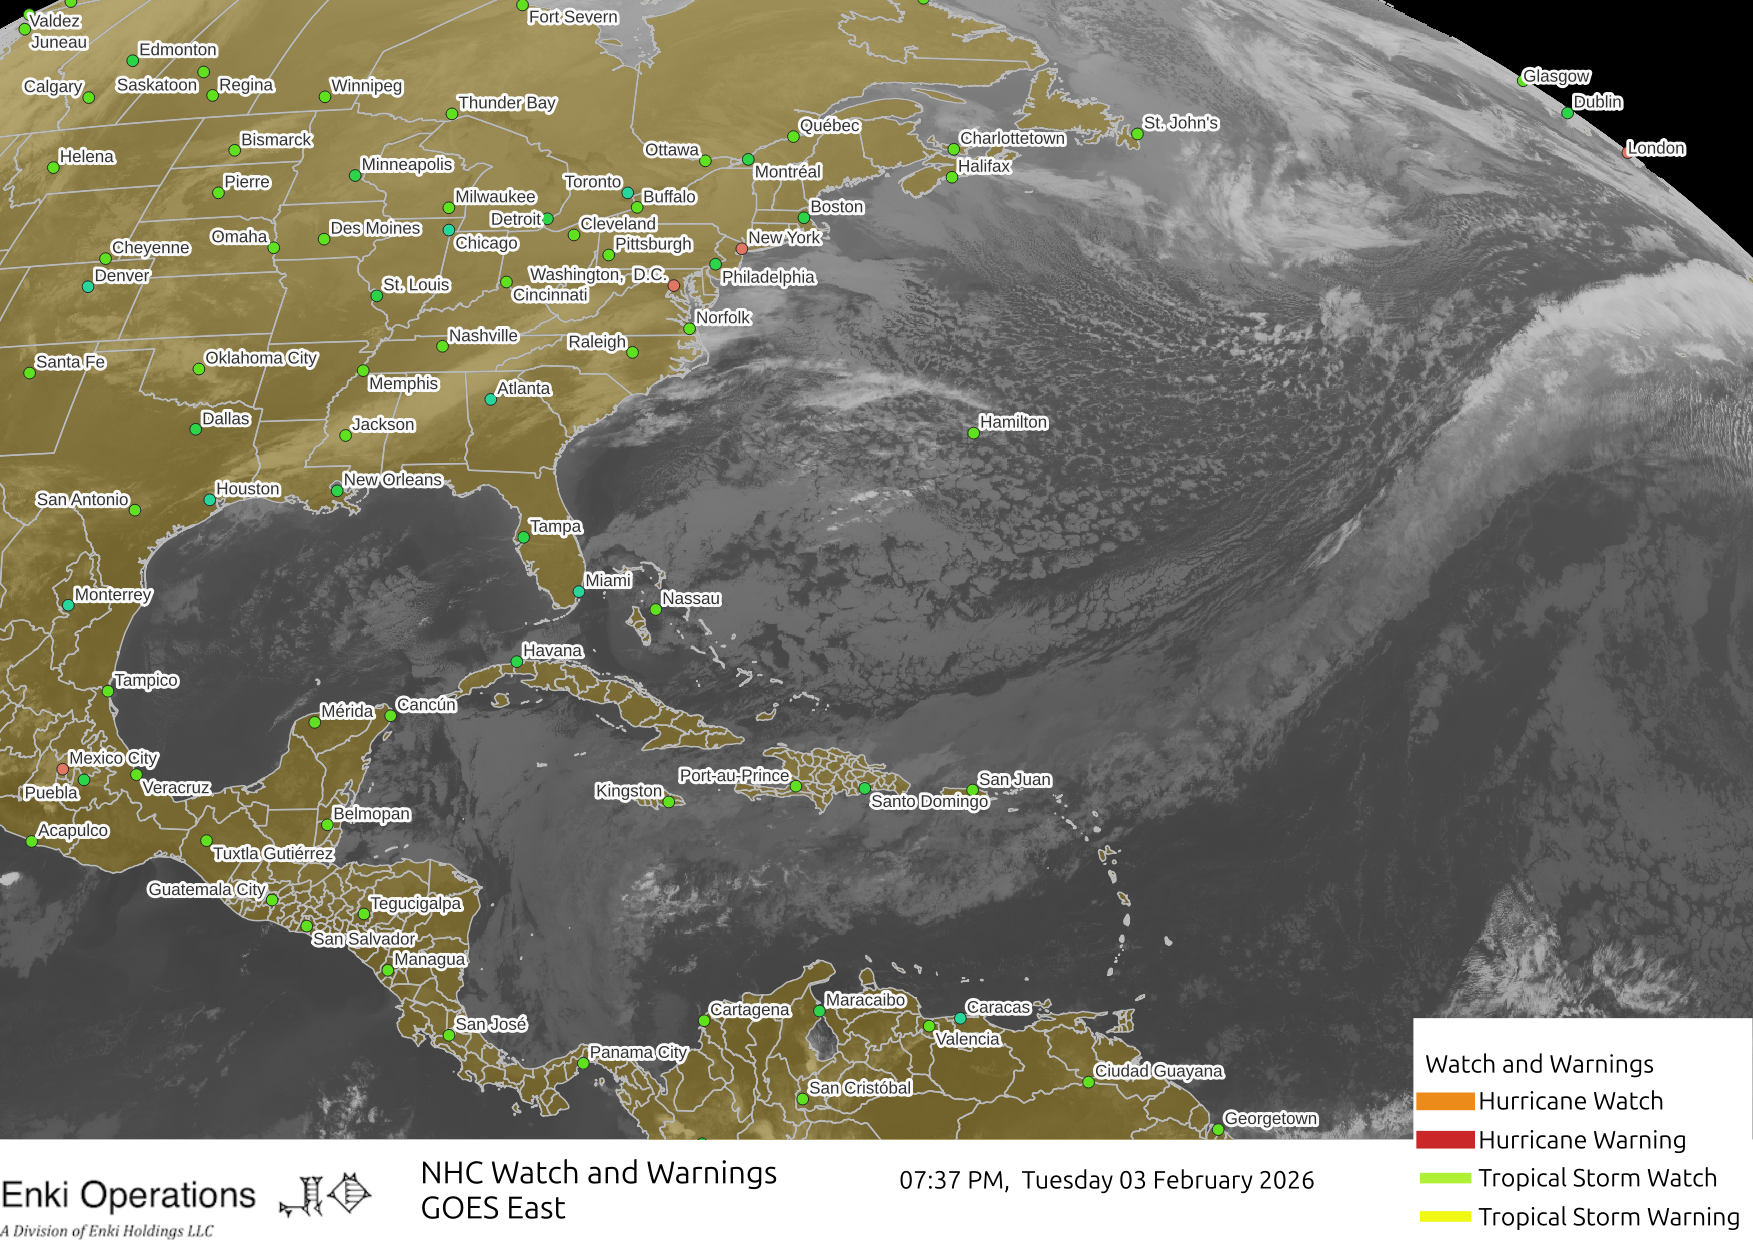
The maps in this section are a mix of National Weather Serivce, Joint Typhoon Warning Center, European Centre For Medium Range Weather Forecasting data, along with NOAA, Japanese Meteorolgical Agency, Roscosmos, and European Meteorological Satellite data compiled and reprojected using QGIS to create hopefully useful information as well as pretty maps.
| Atlantic | East Pacific | West Pacific |
|---|---|---|
|
|
|
|
| Indian Ocean | Australia | SWIO |
|---|---|---|
|
|
|
| Atlantic | East Pacific | Central Pacific |
|---|---|---|
|
|
|
These maps are more detailed information for each invest area or active storm. There are currently three maps for each area or storm.
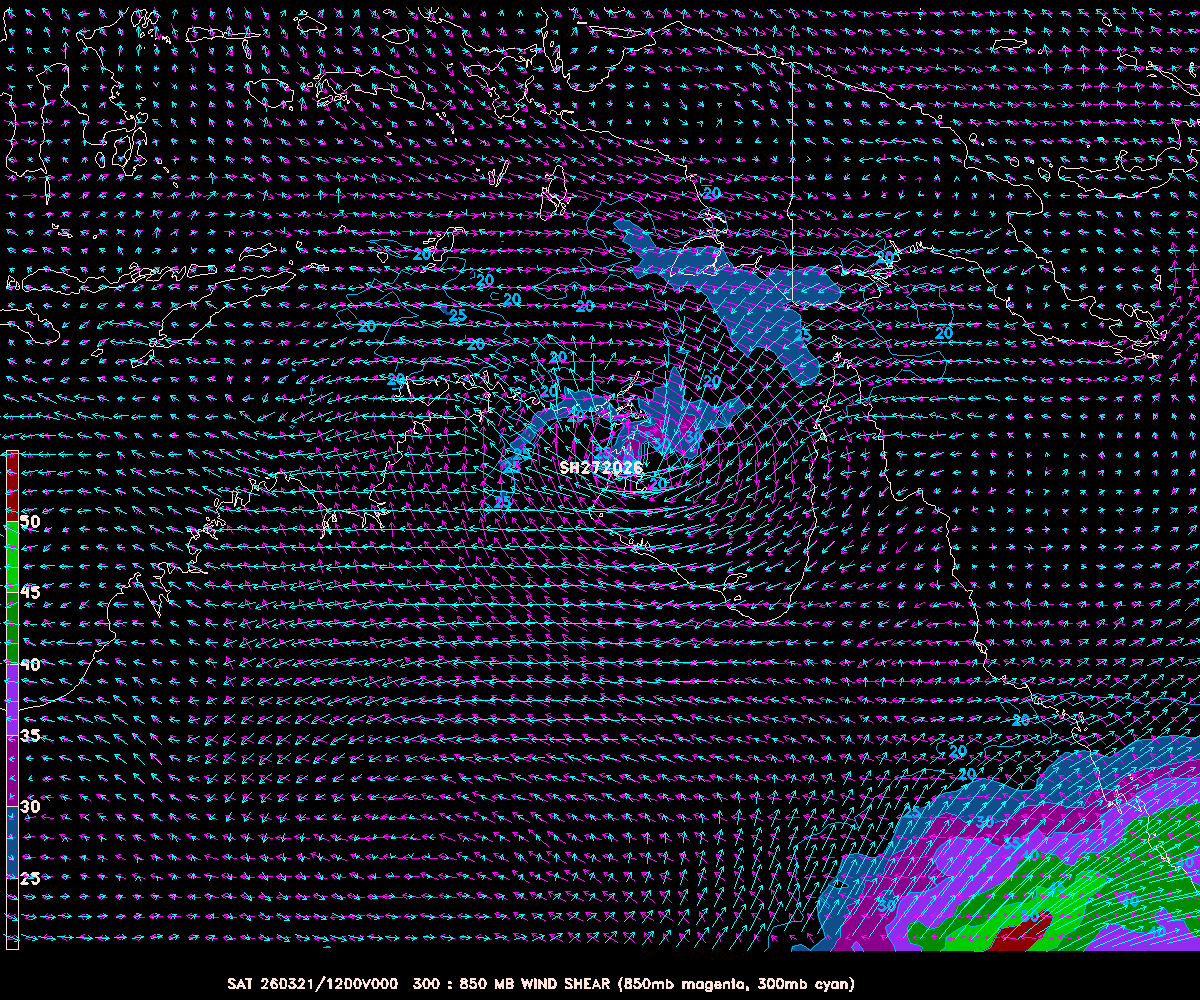
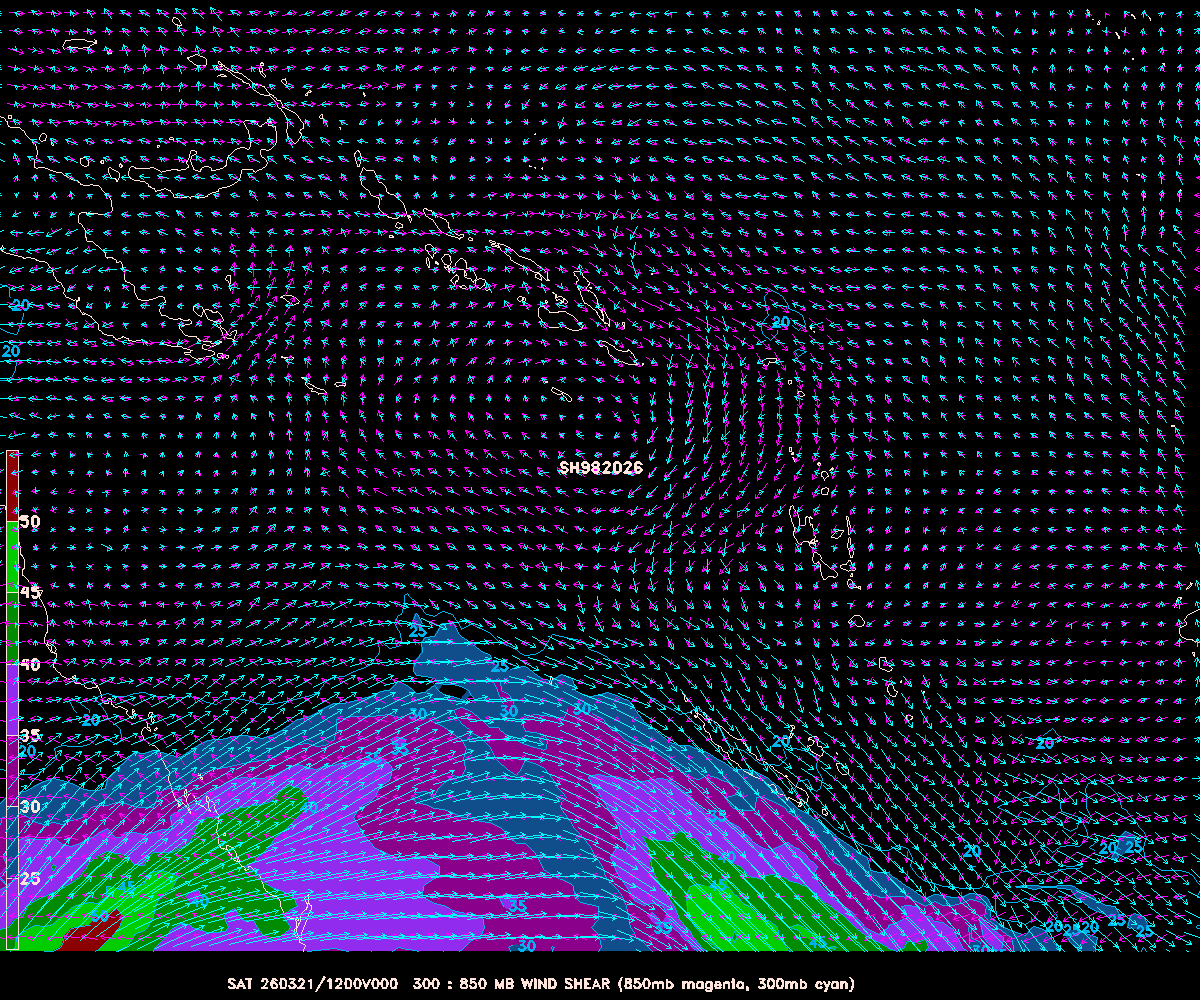
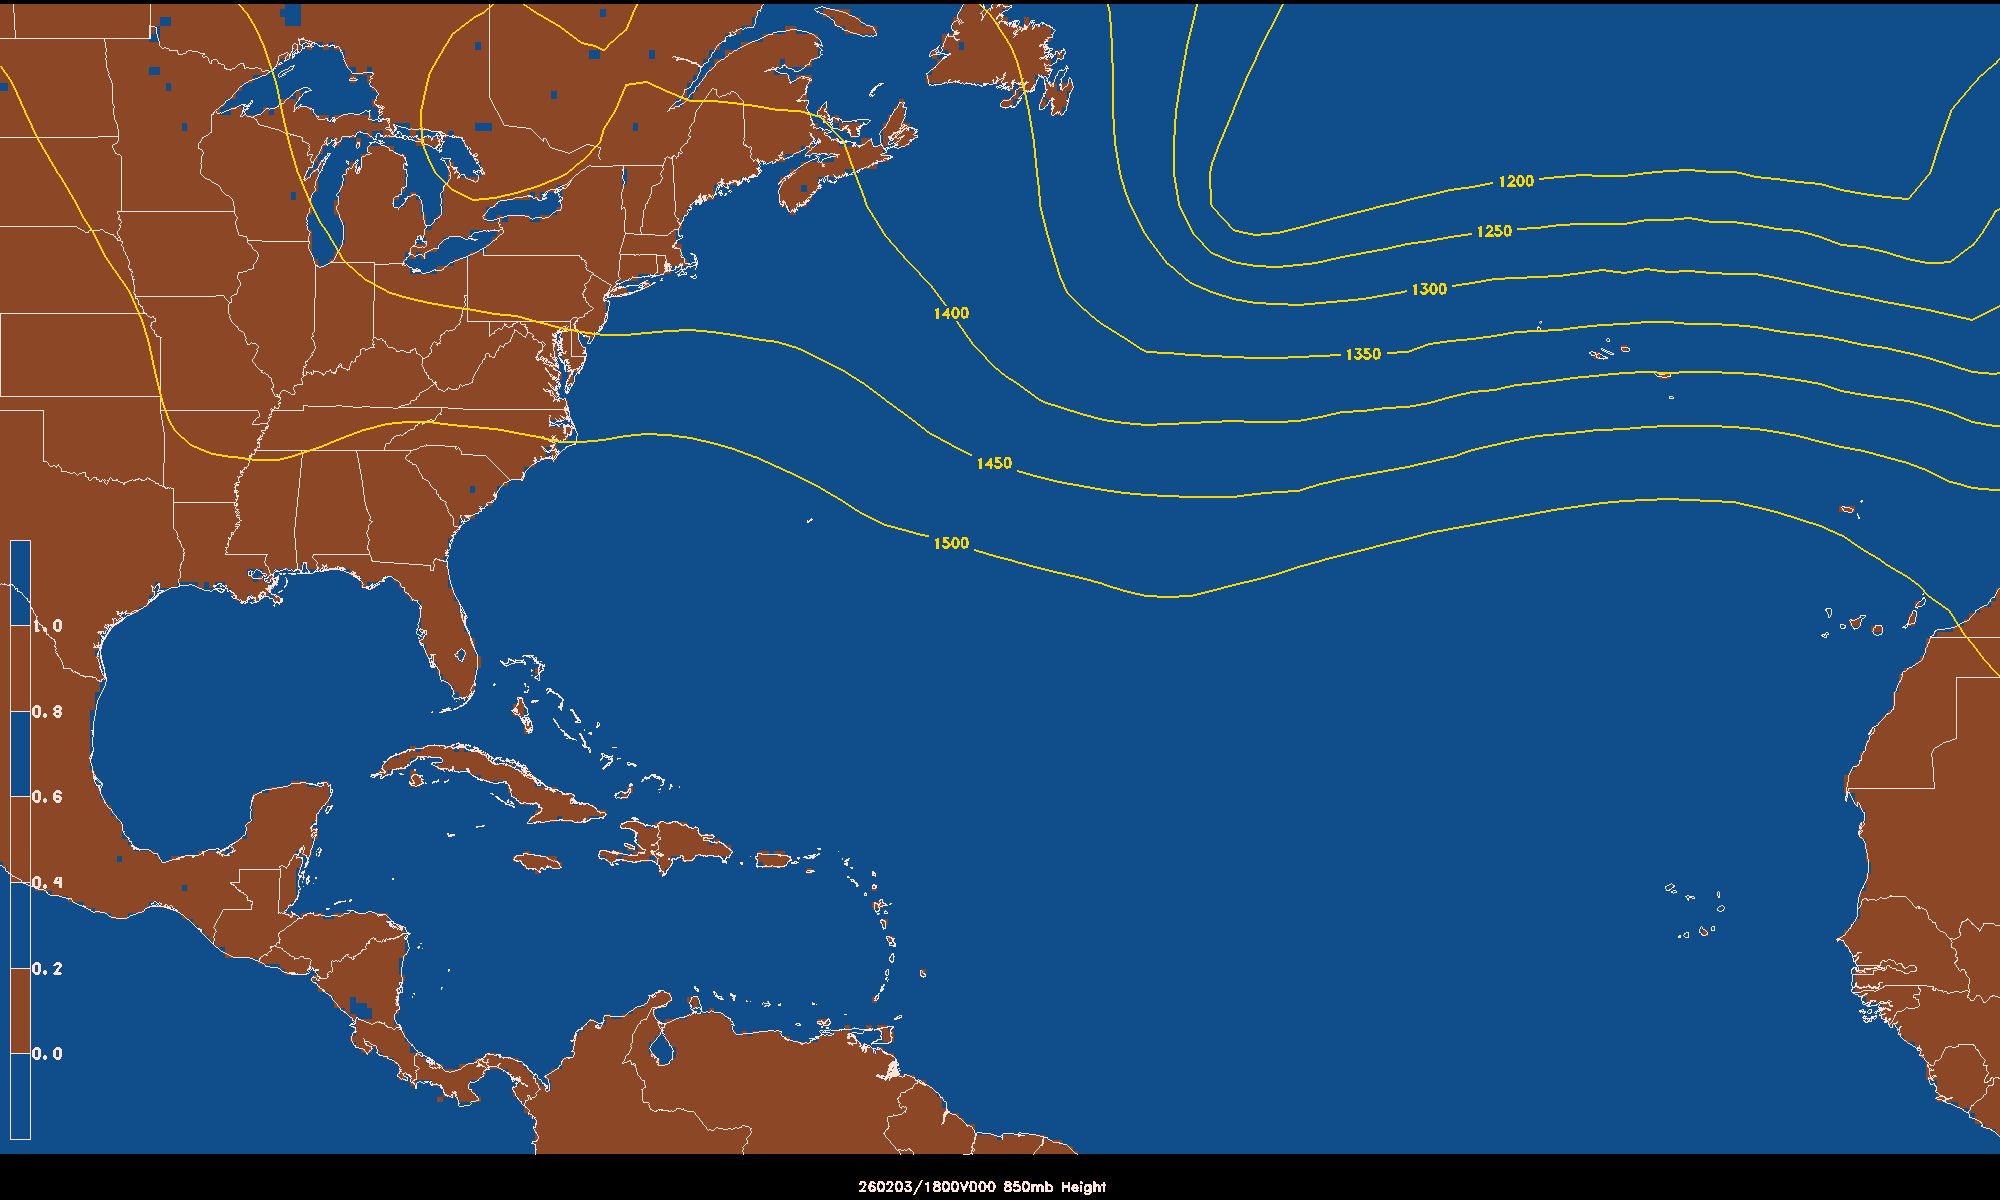
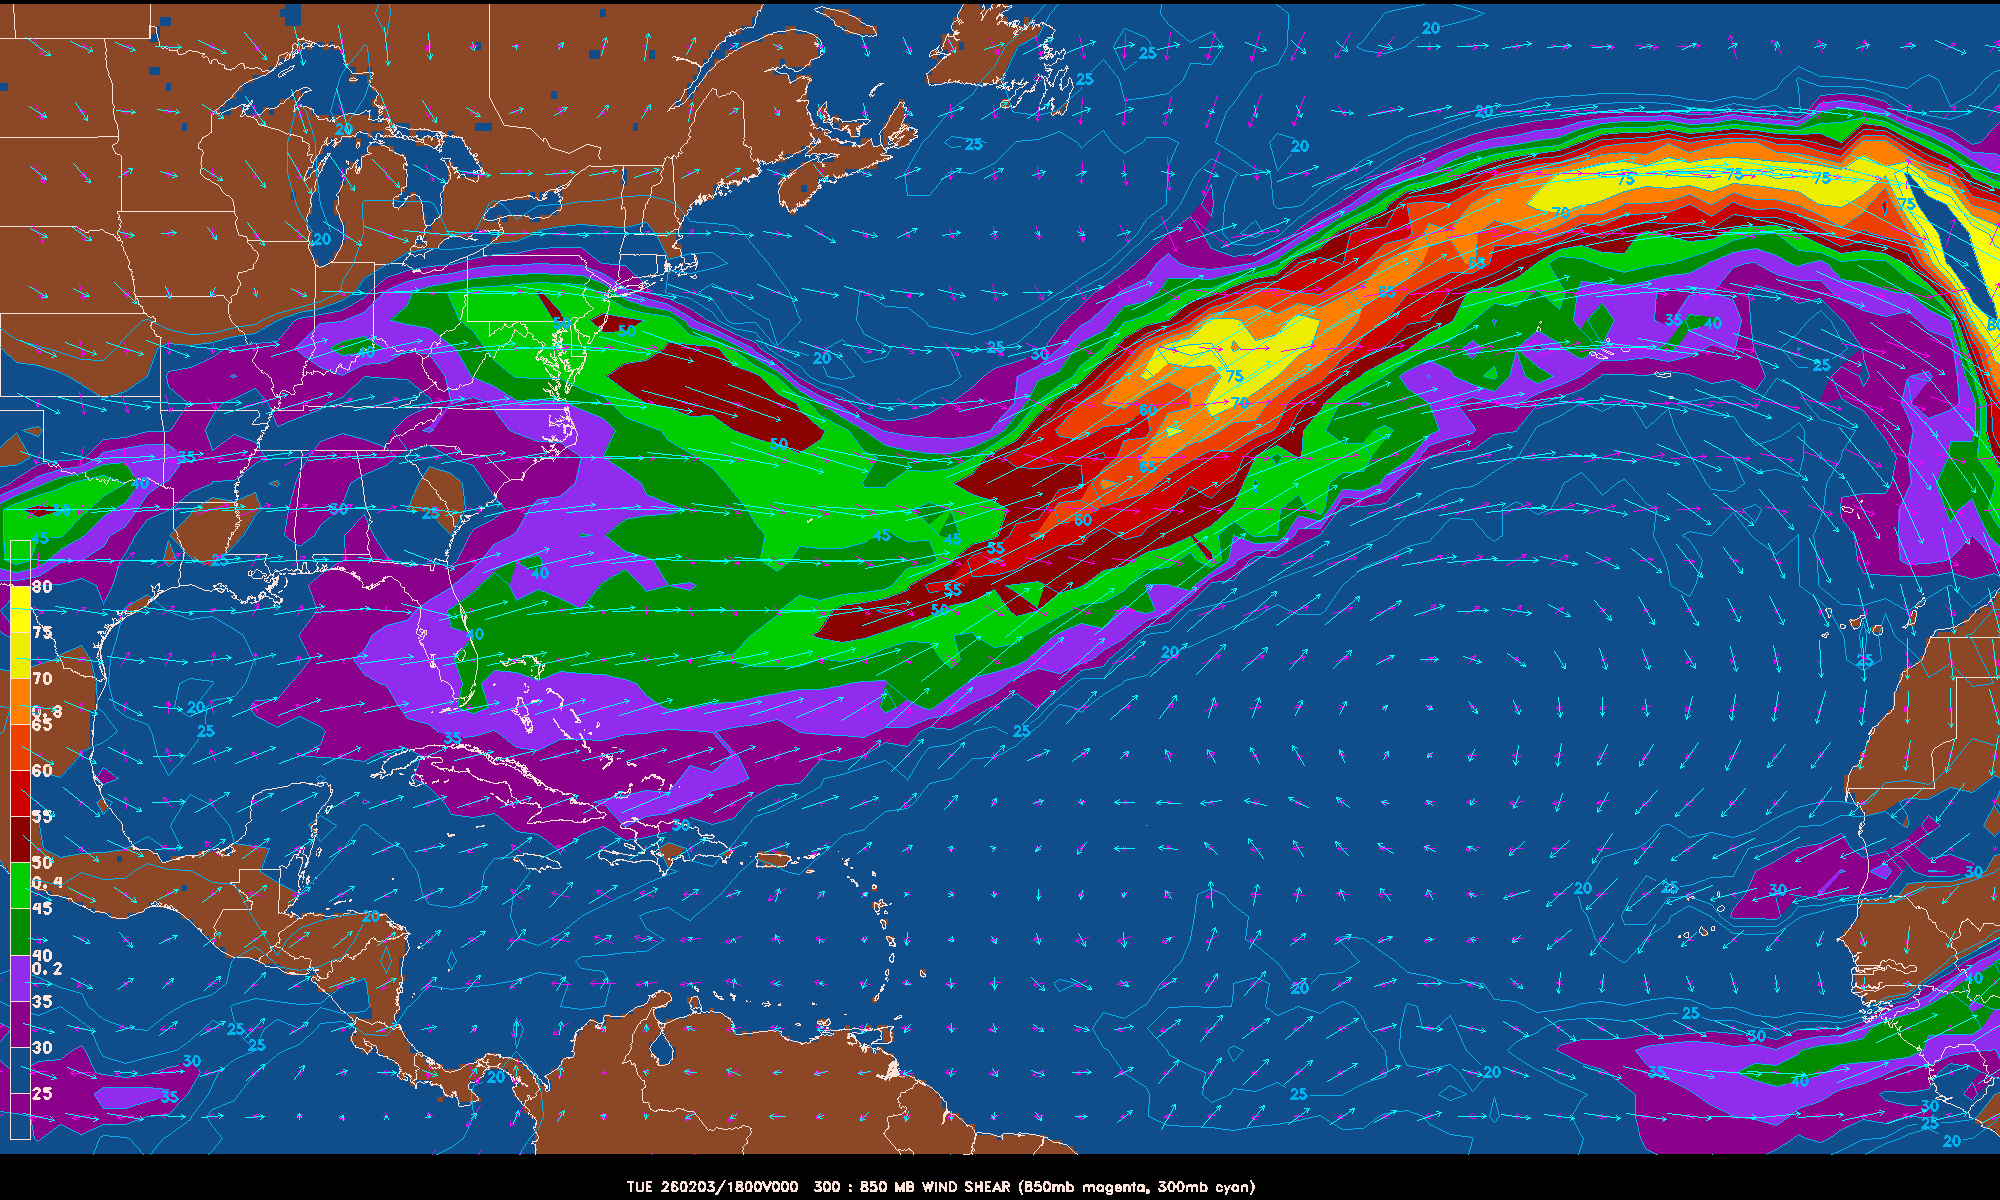
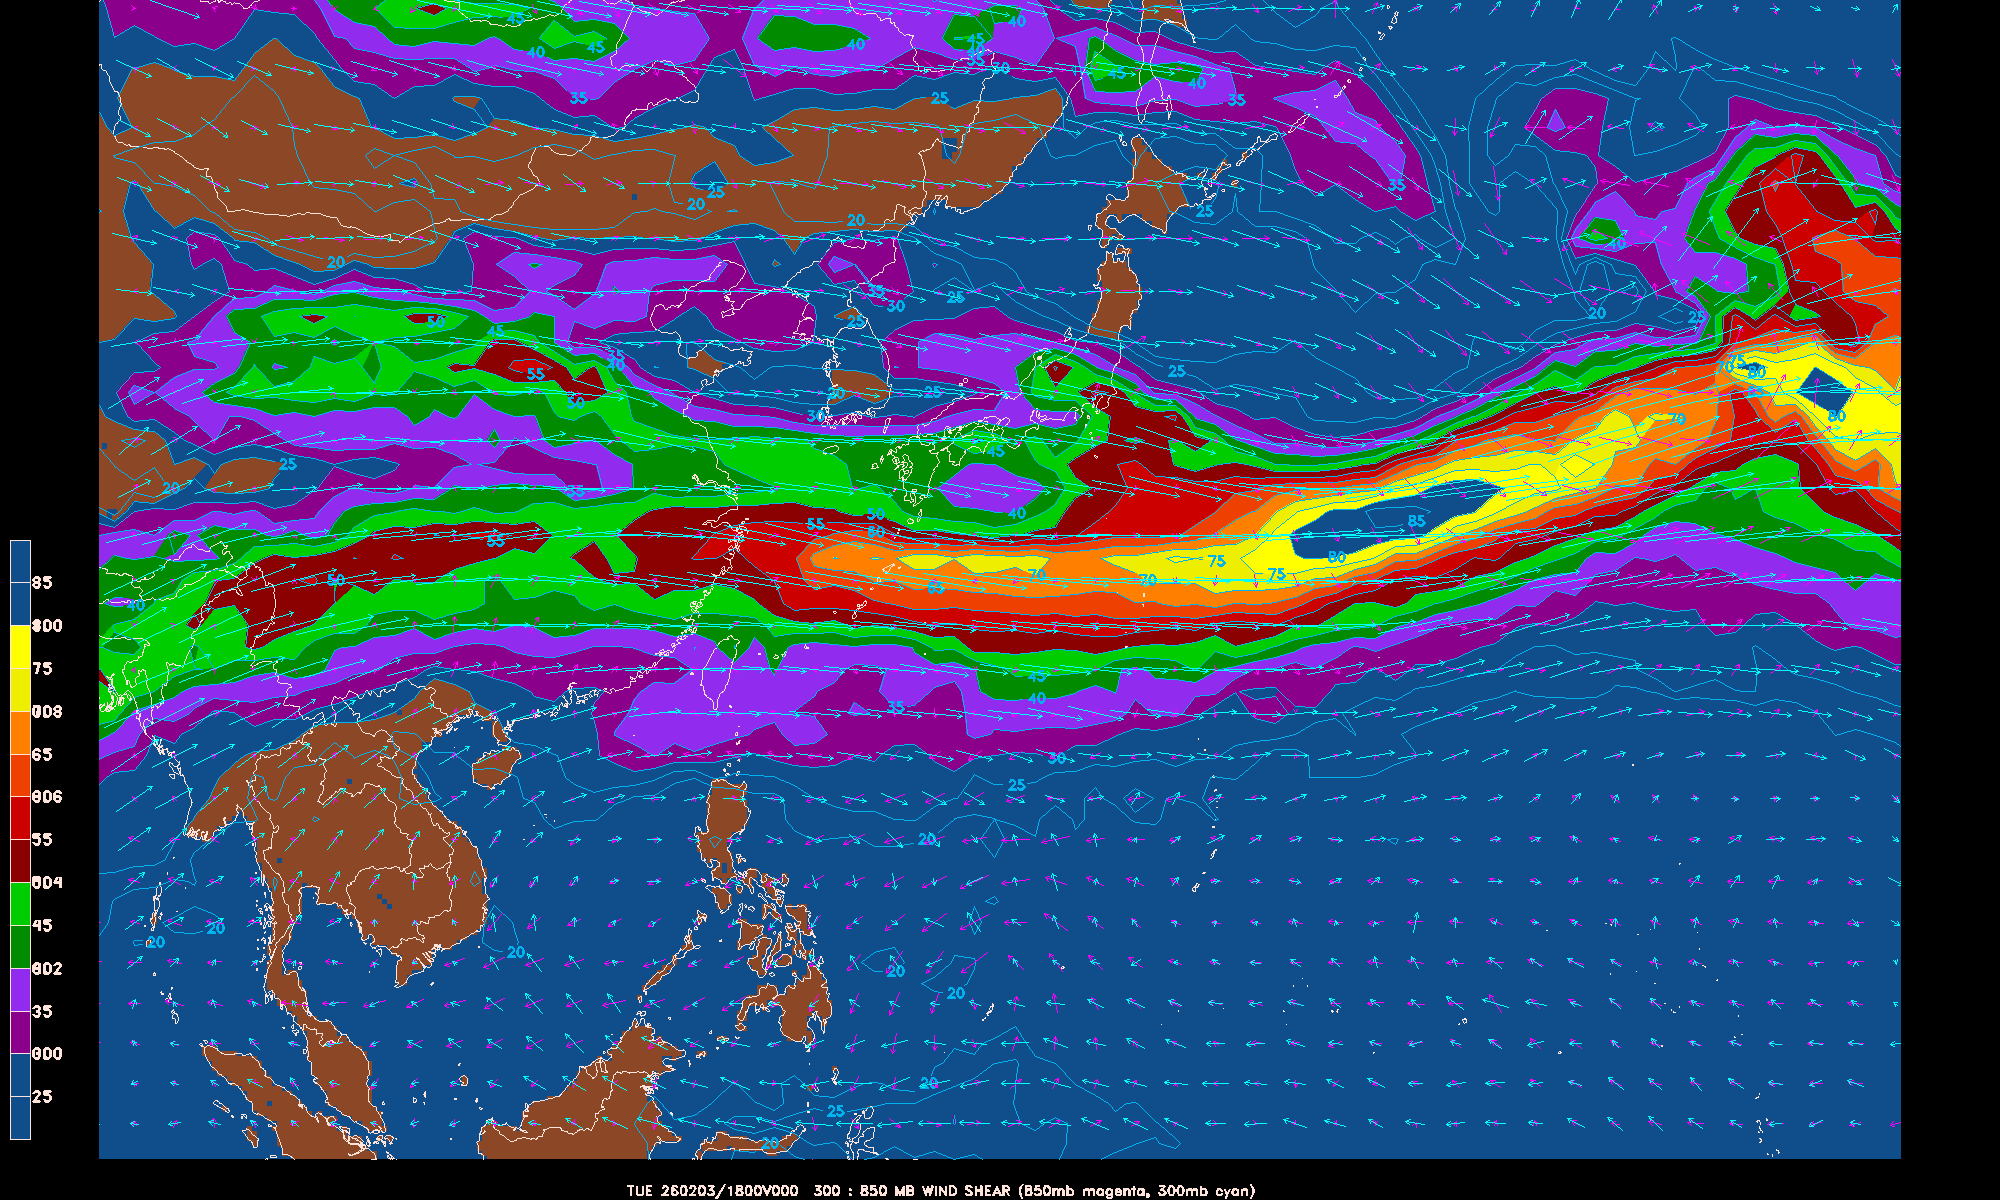
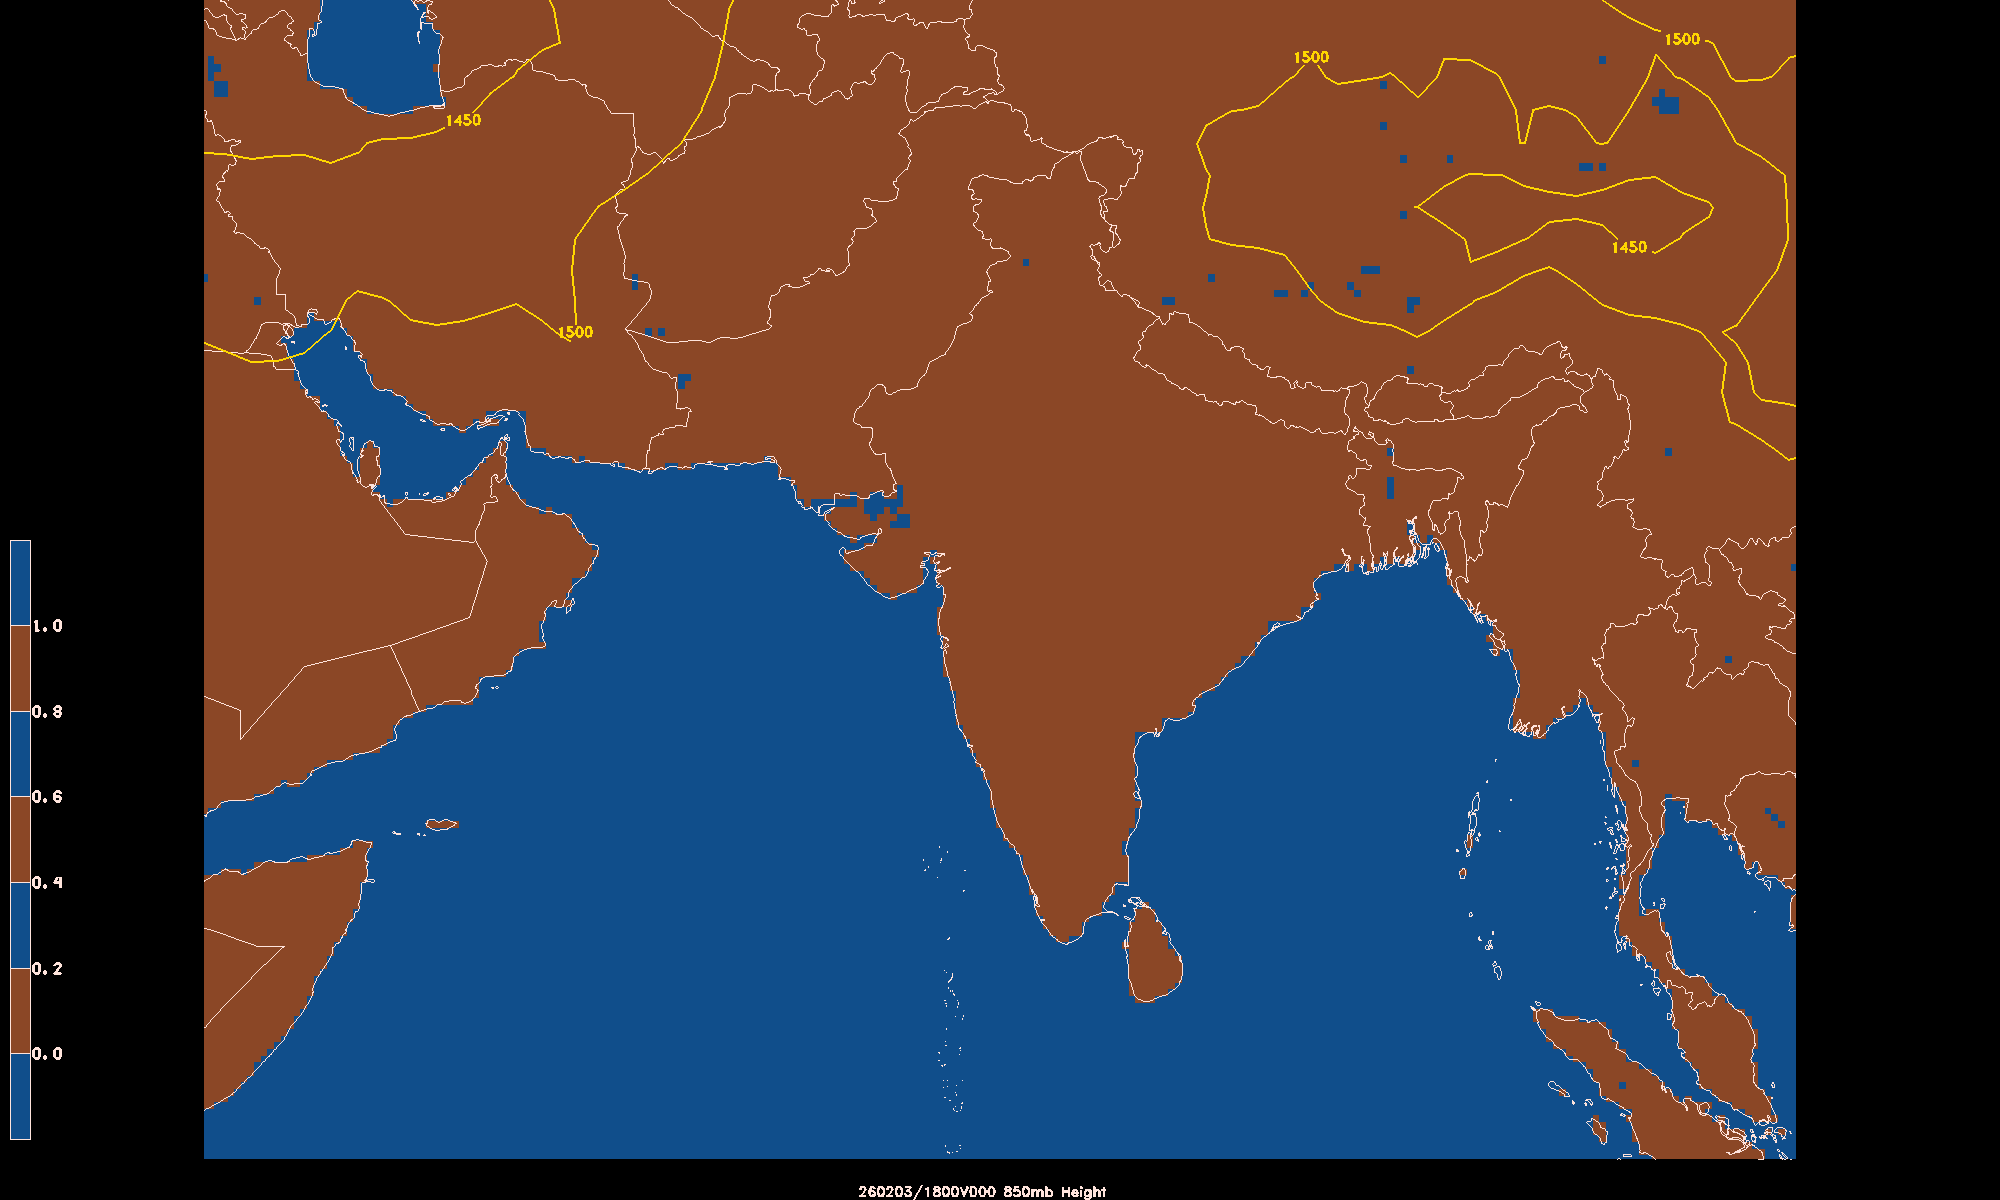
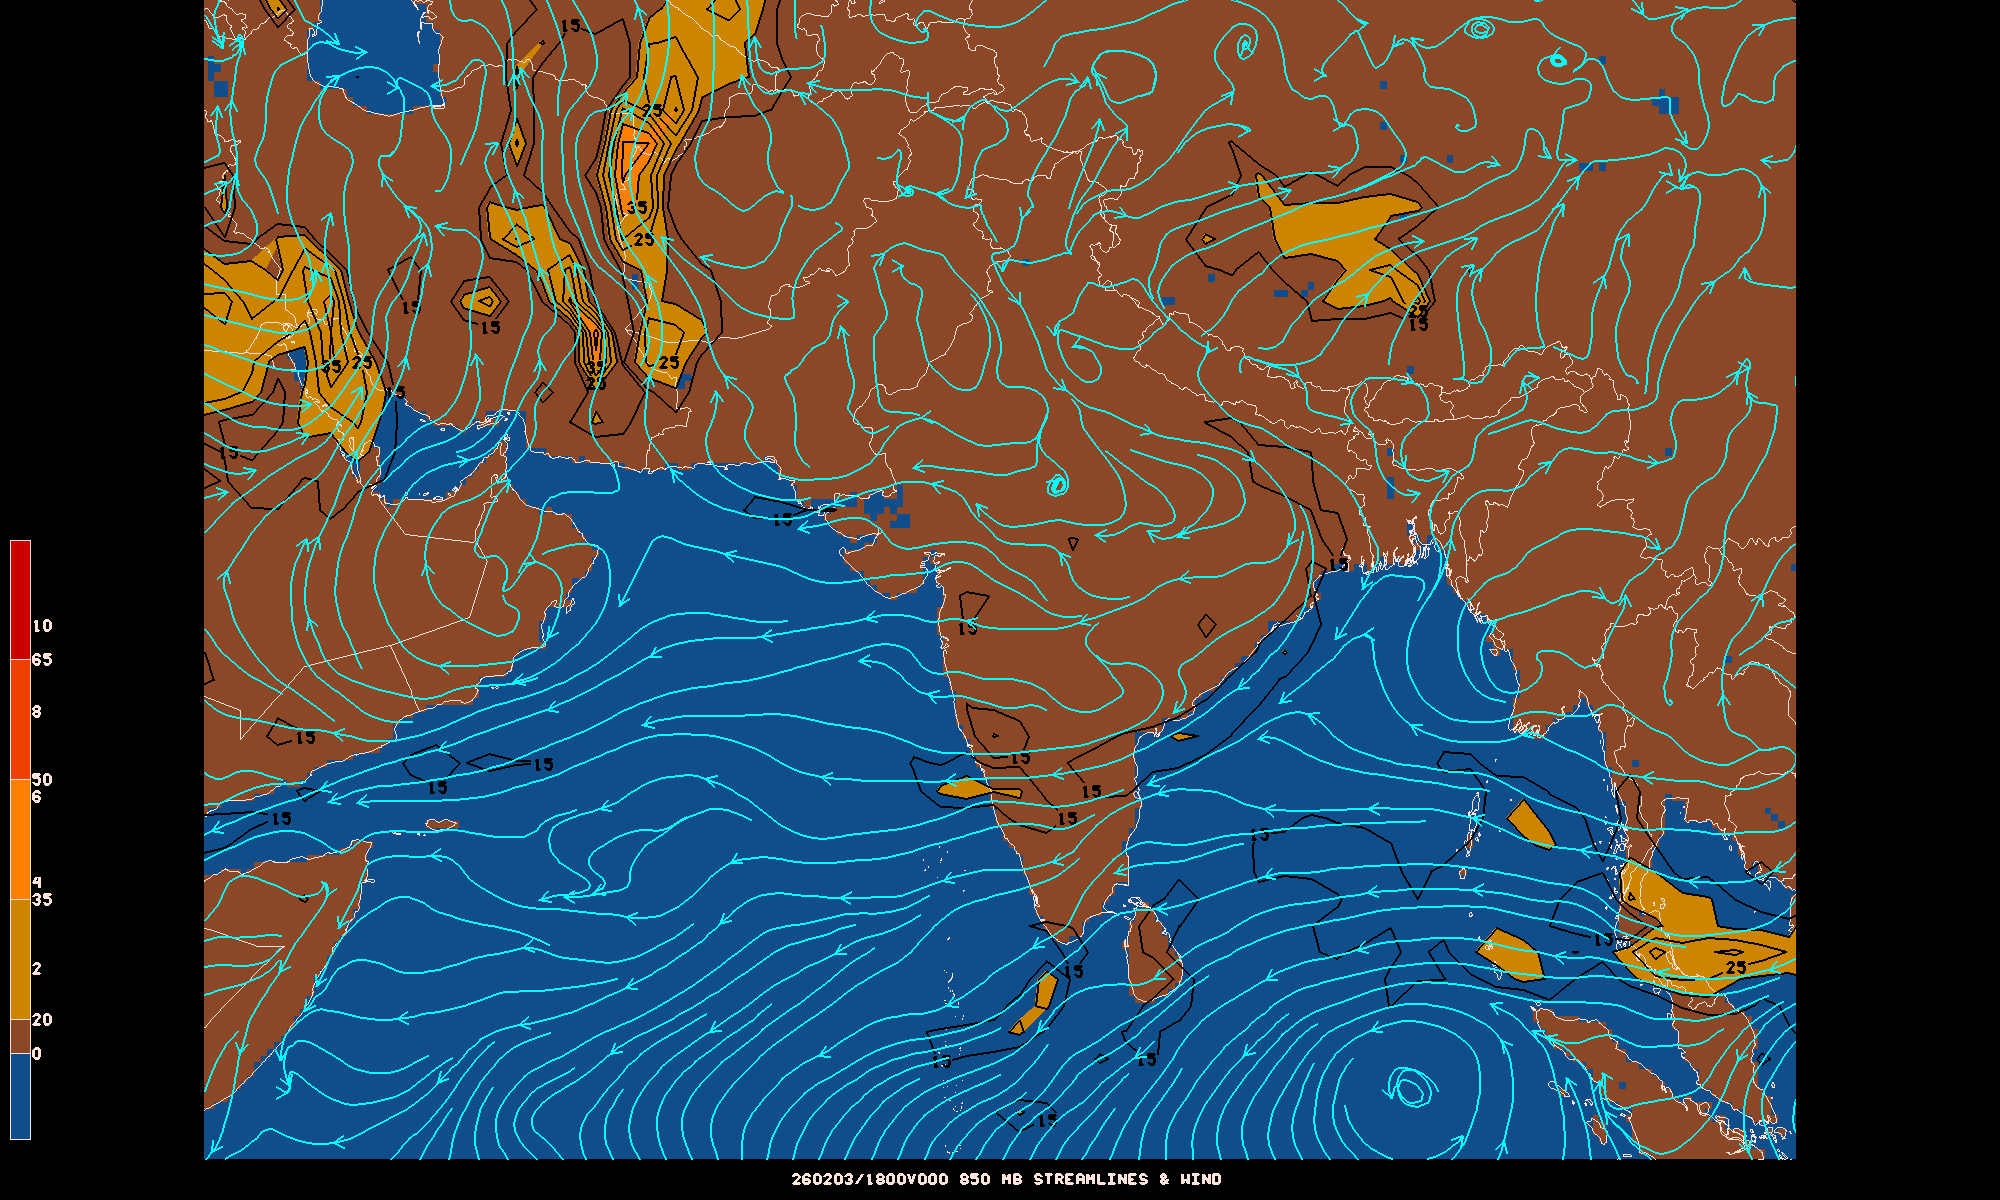
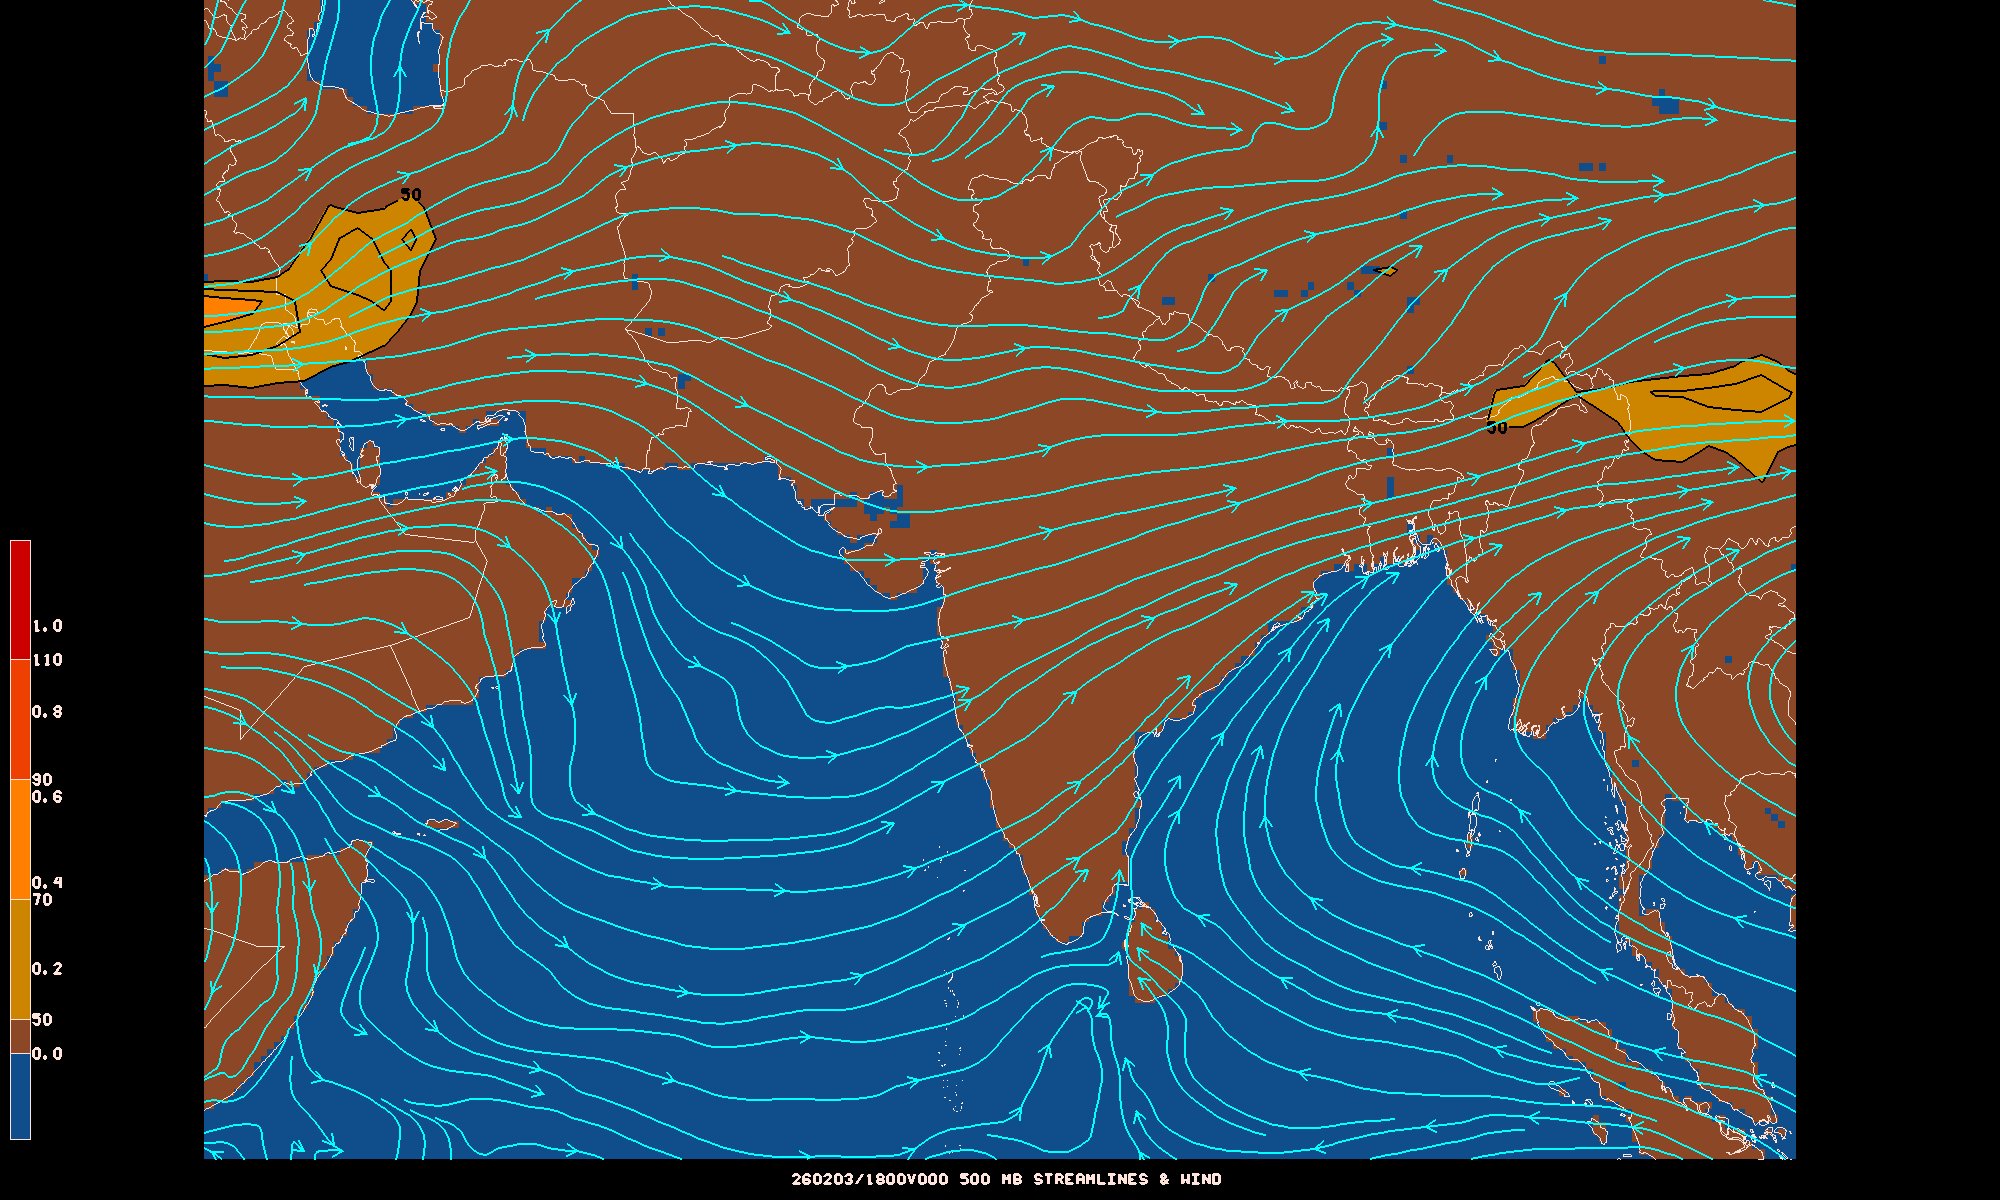
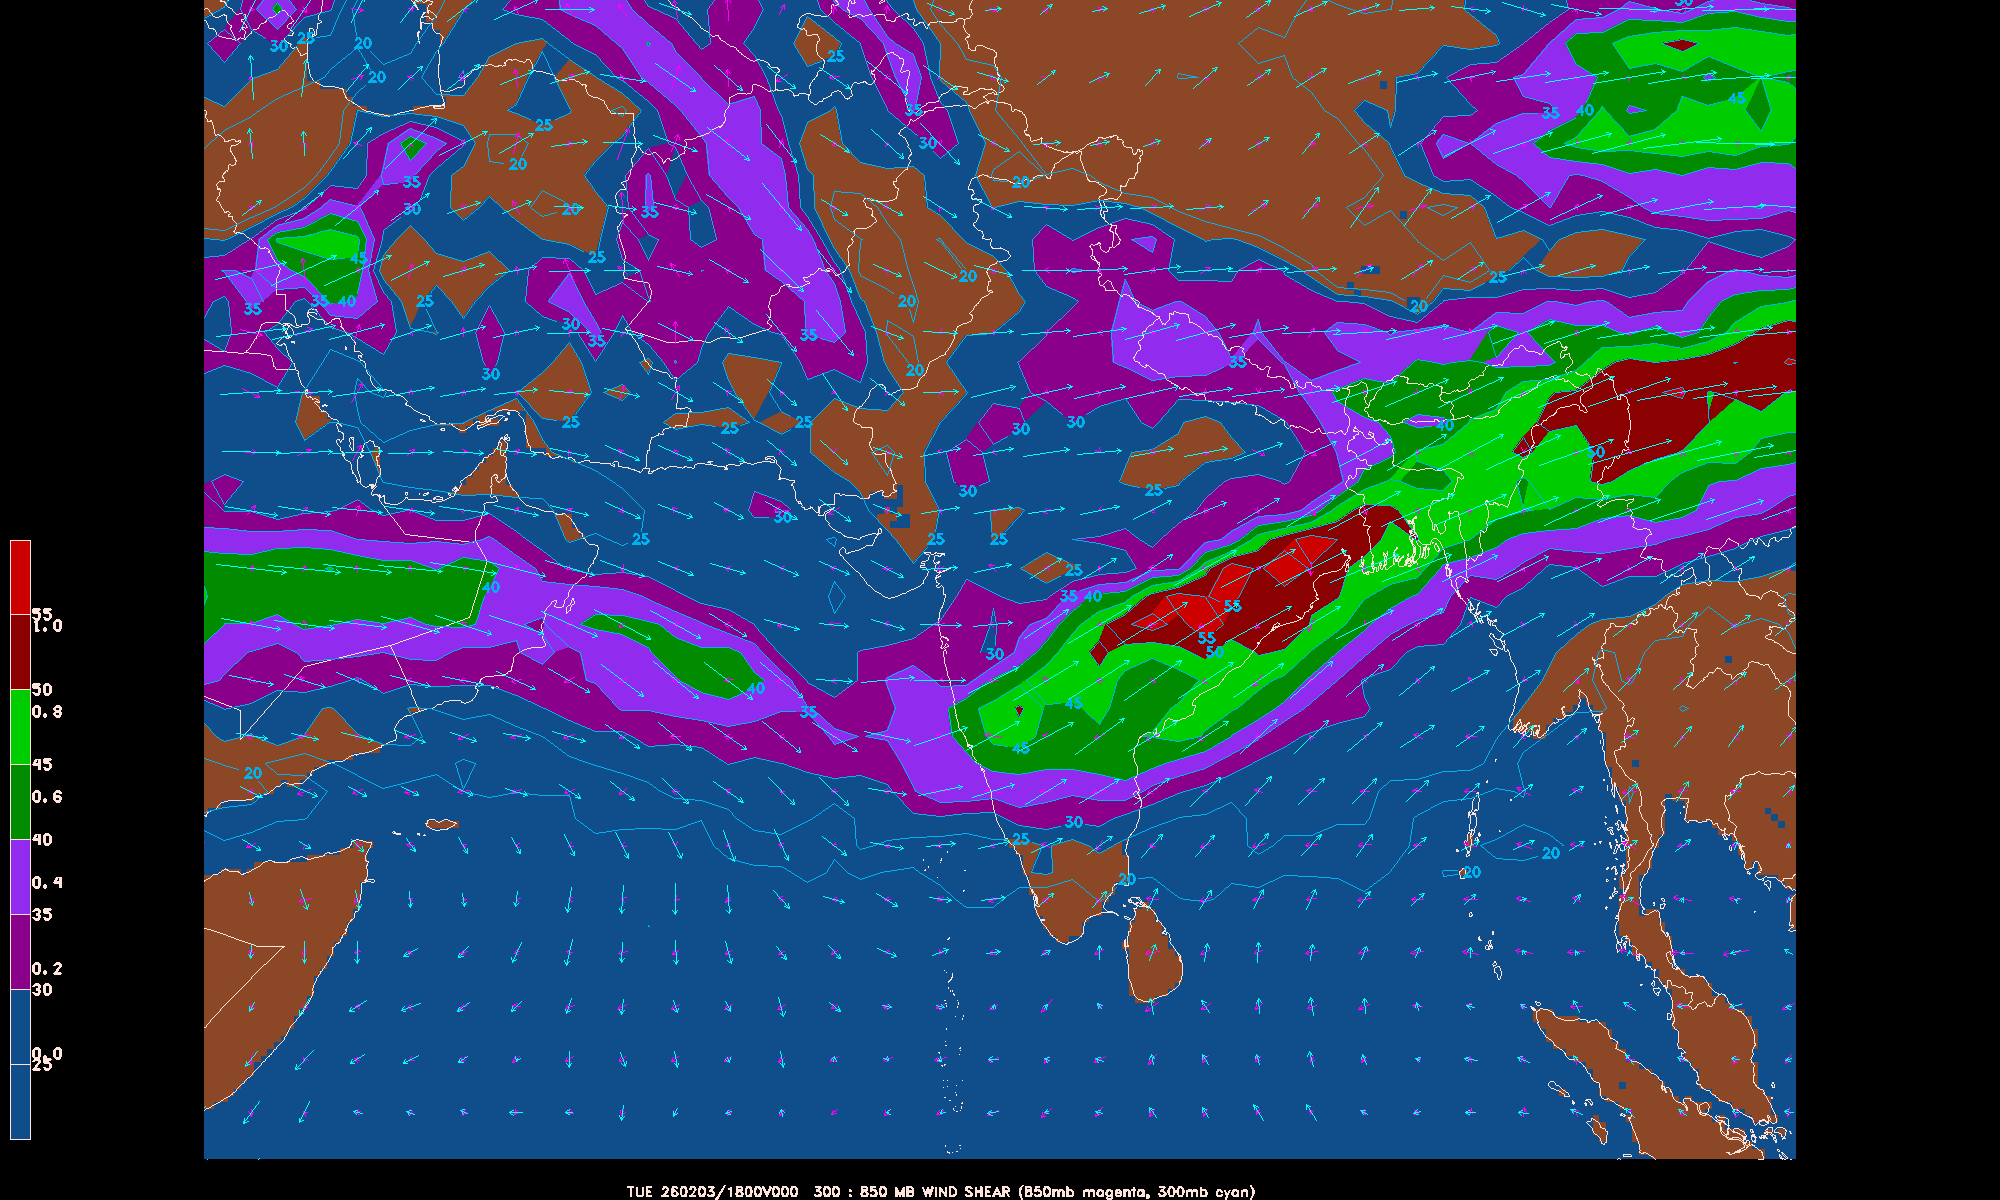
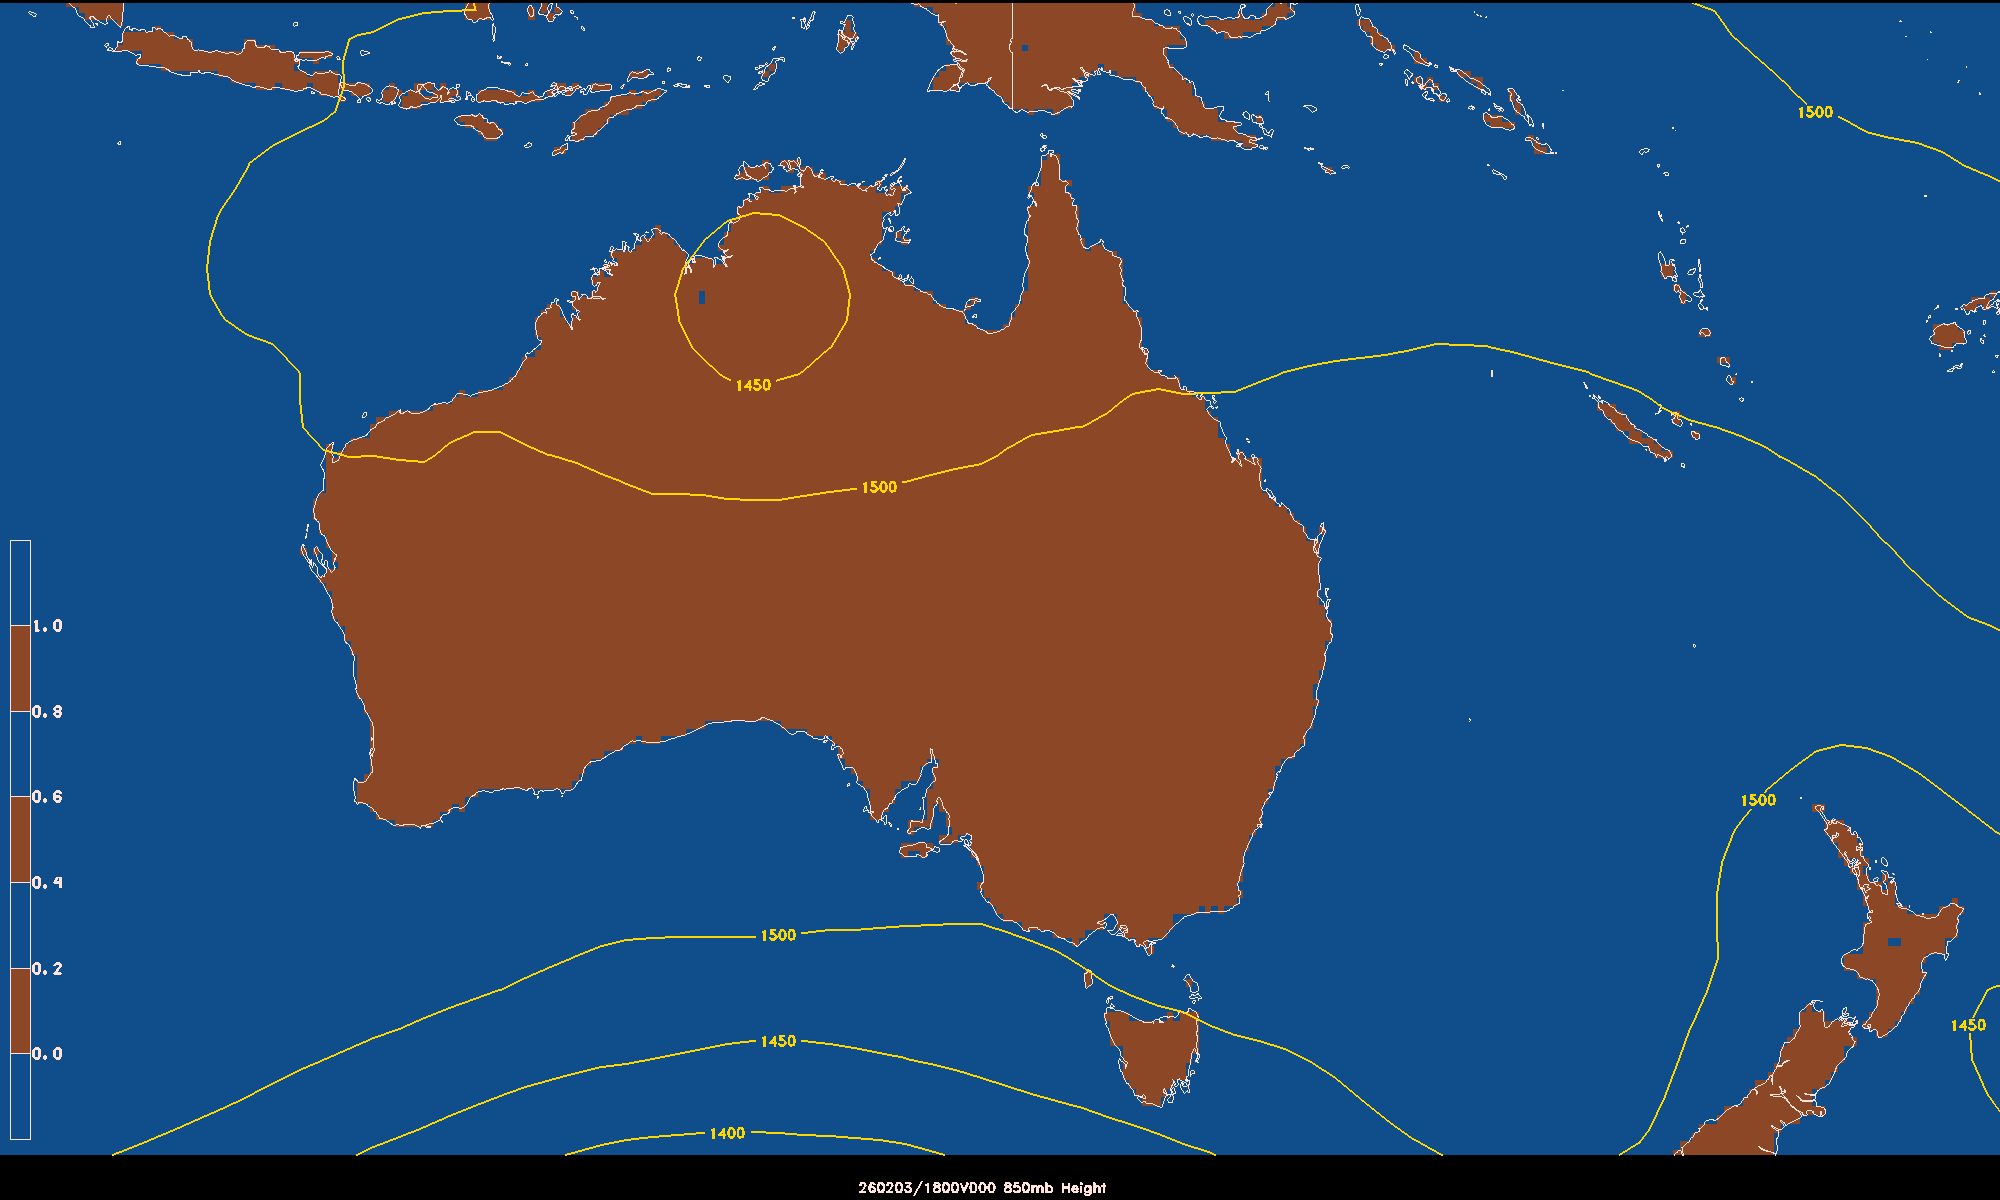
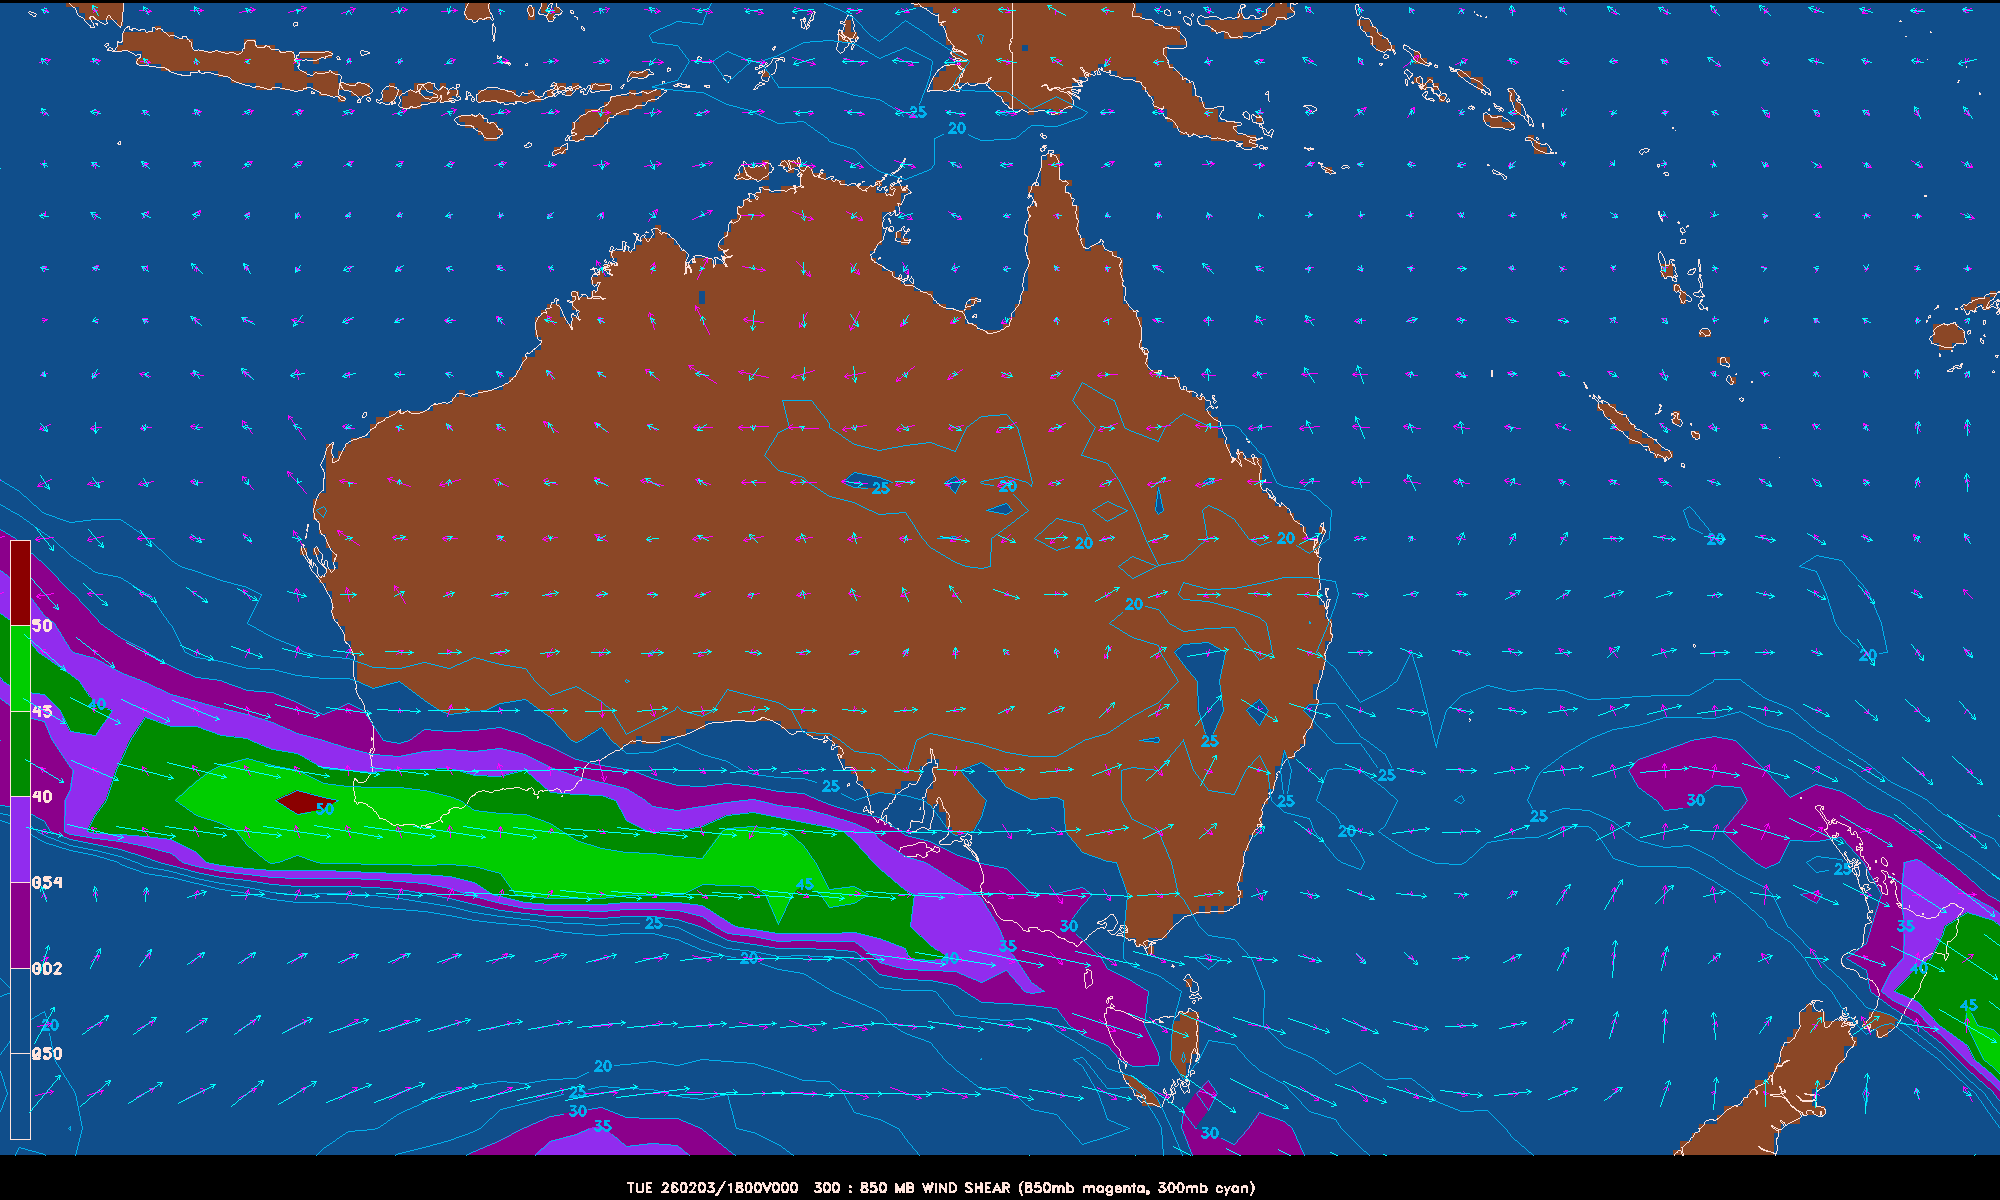
The first map is a GEMPAK map showing the surface winds and 850mb pressure heights from the GFS initialization run for each storm. This is a good indication of the organization of the storm. A well organized storm will have a nice circular pattern to the H850 (yellow lines), and winds centered over them. The second map is also a GEMPAK map of the wind shear around each storm, showing the difference between the low altitude (850mb, about 5,000 ft up) and high altitude (300mb is around 30,000 ft) winds. Colored areas are of high shear, generally unhealthy for tropical cyclones.
The third map shows the result of a simulation of the storm using my TAOS(tm) storm hazard model, with the colored areas showing the potential impacts in plain English (eg "Large Trees Sway" or "Widespread Damage"). The estimated economic impact from my Lachesis economic model is also indicated, in US Purchasing Power Parity Dollars.
| ATCF ID | GFS SFC Wind Analysis | GFS Wind Shear | TAOS(tm) simulation | Track Model Statistics |
|---|---|---|---|---|
| SH272026 NARELLE | 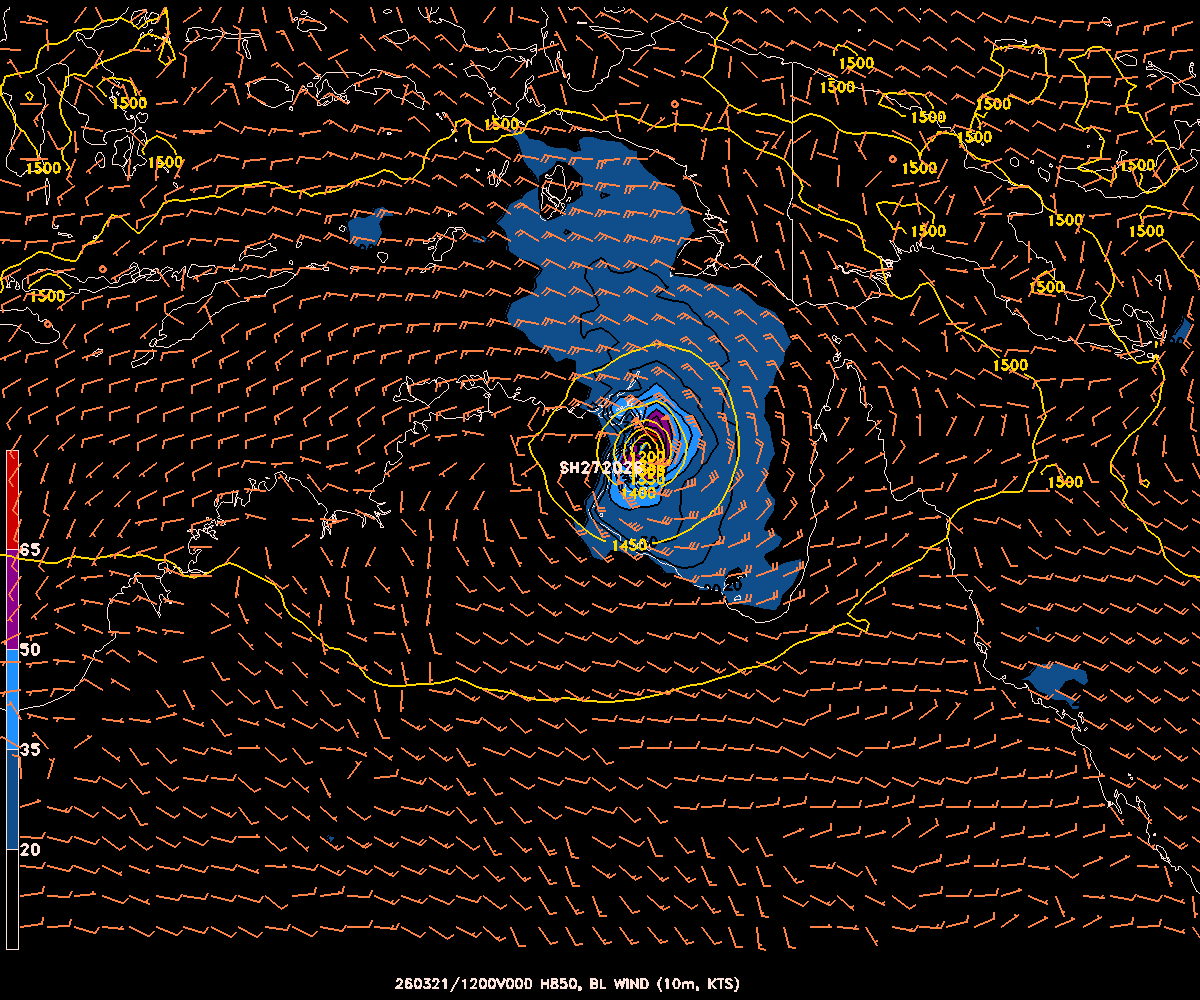 |
 |
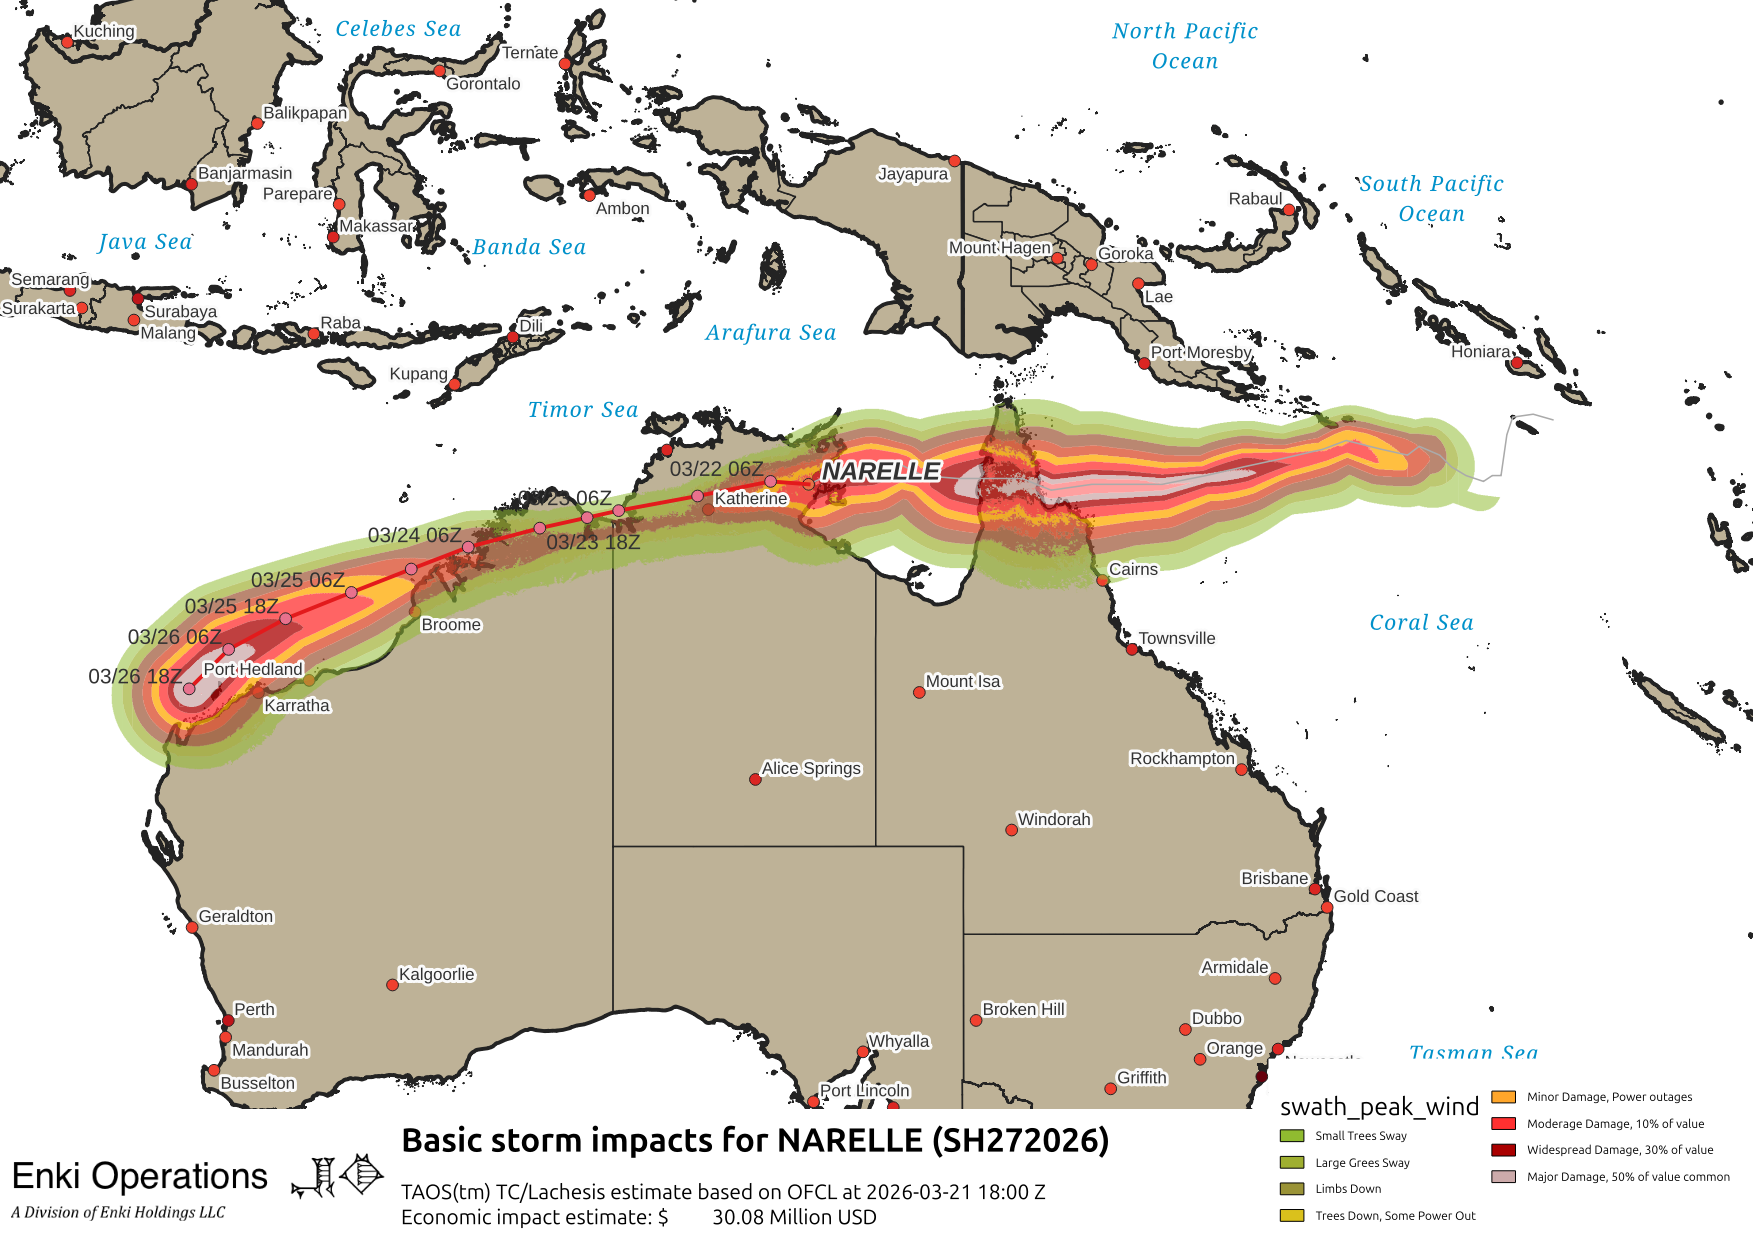 OFCL sim as of 2026-03-21 18:00 Impact: $ $ 30.08 Million USD USD |
 |
| SH982026 INVEST | 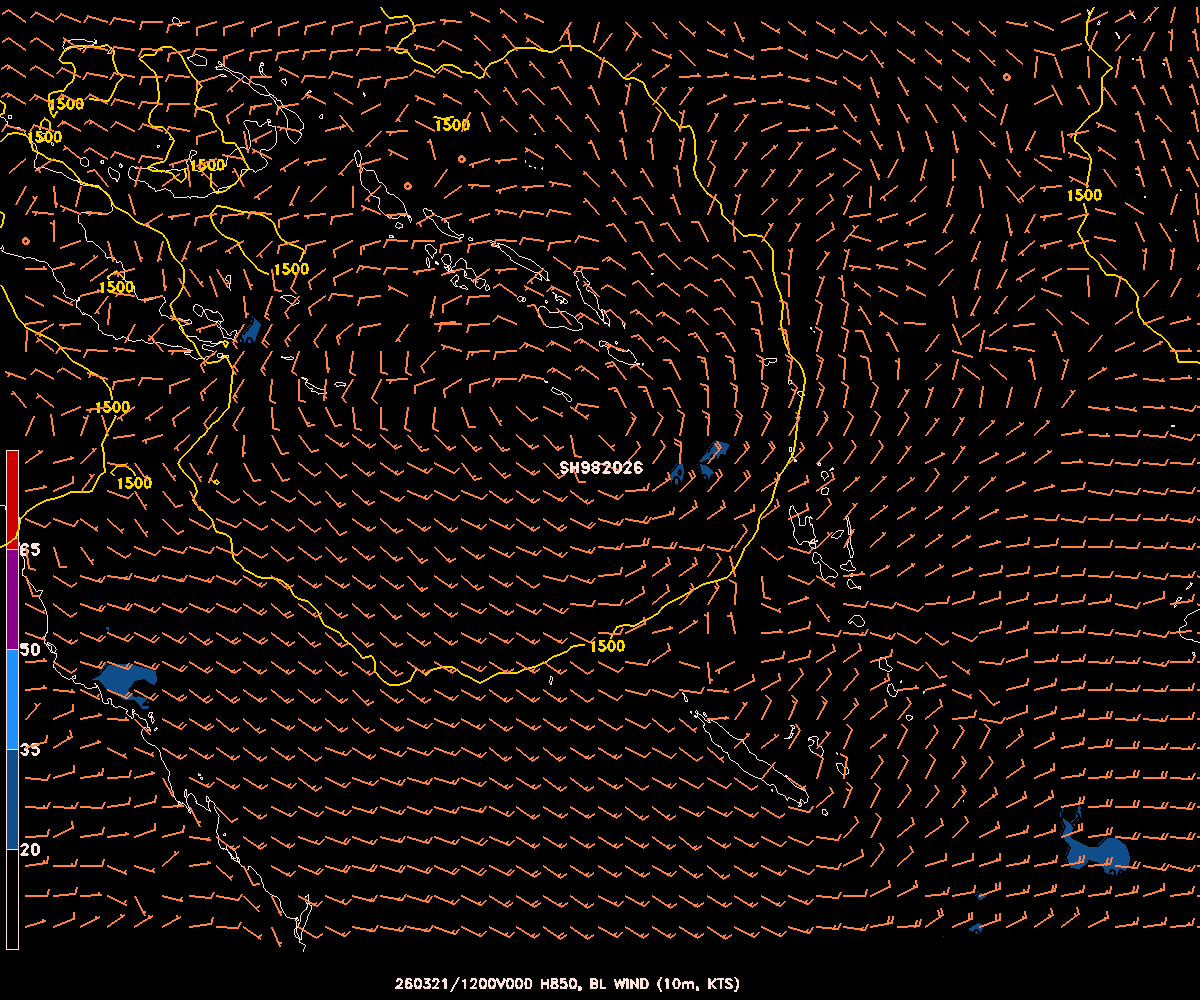 |
 |
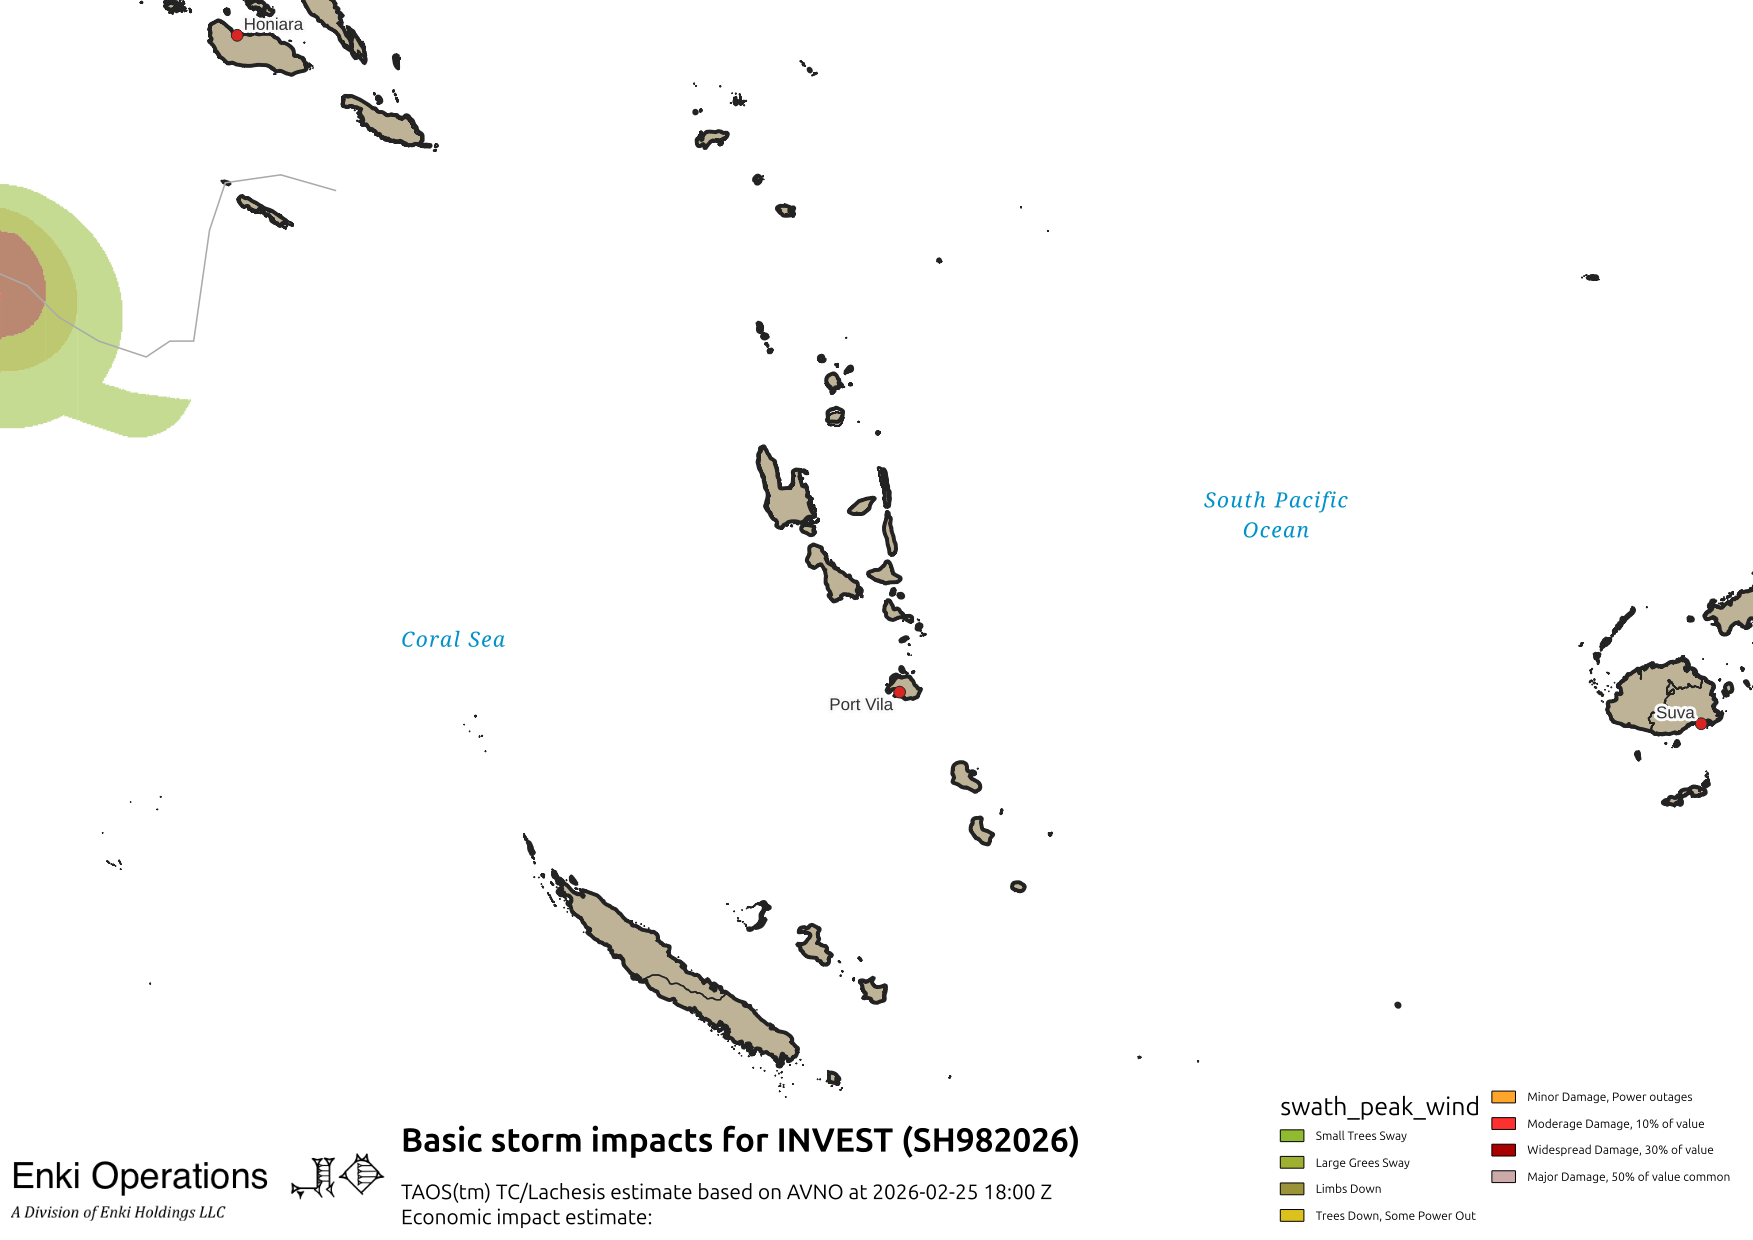 AVNO sim as of 2026-02-25 18:00 Impact: $ USD |
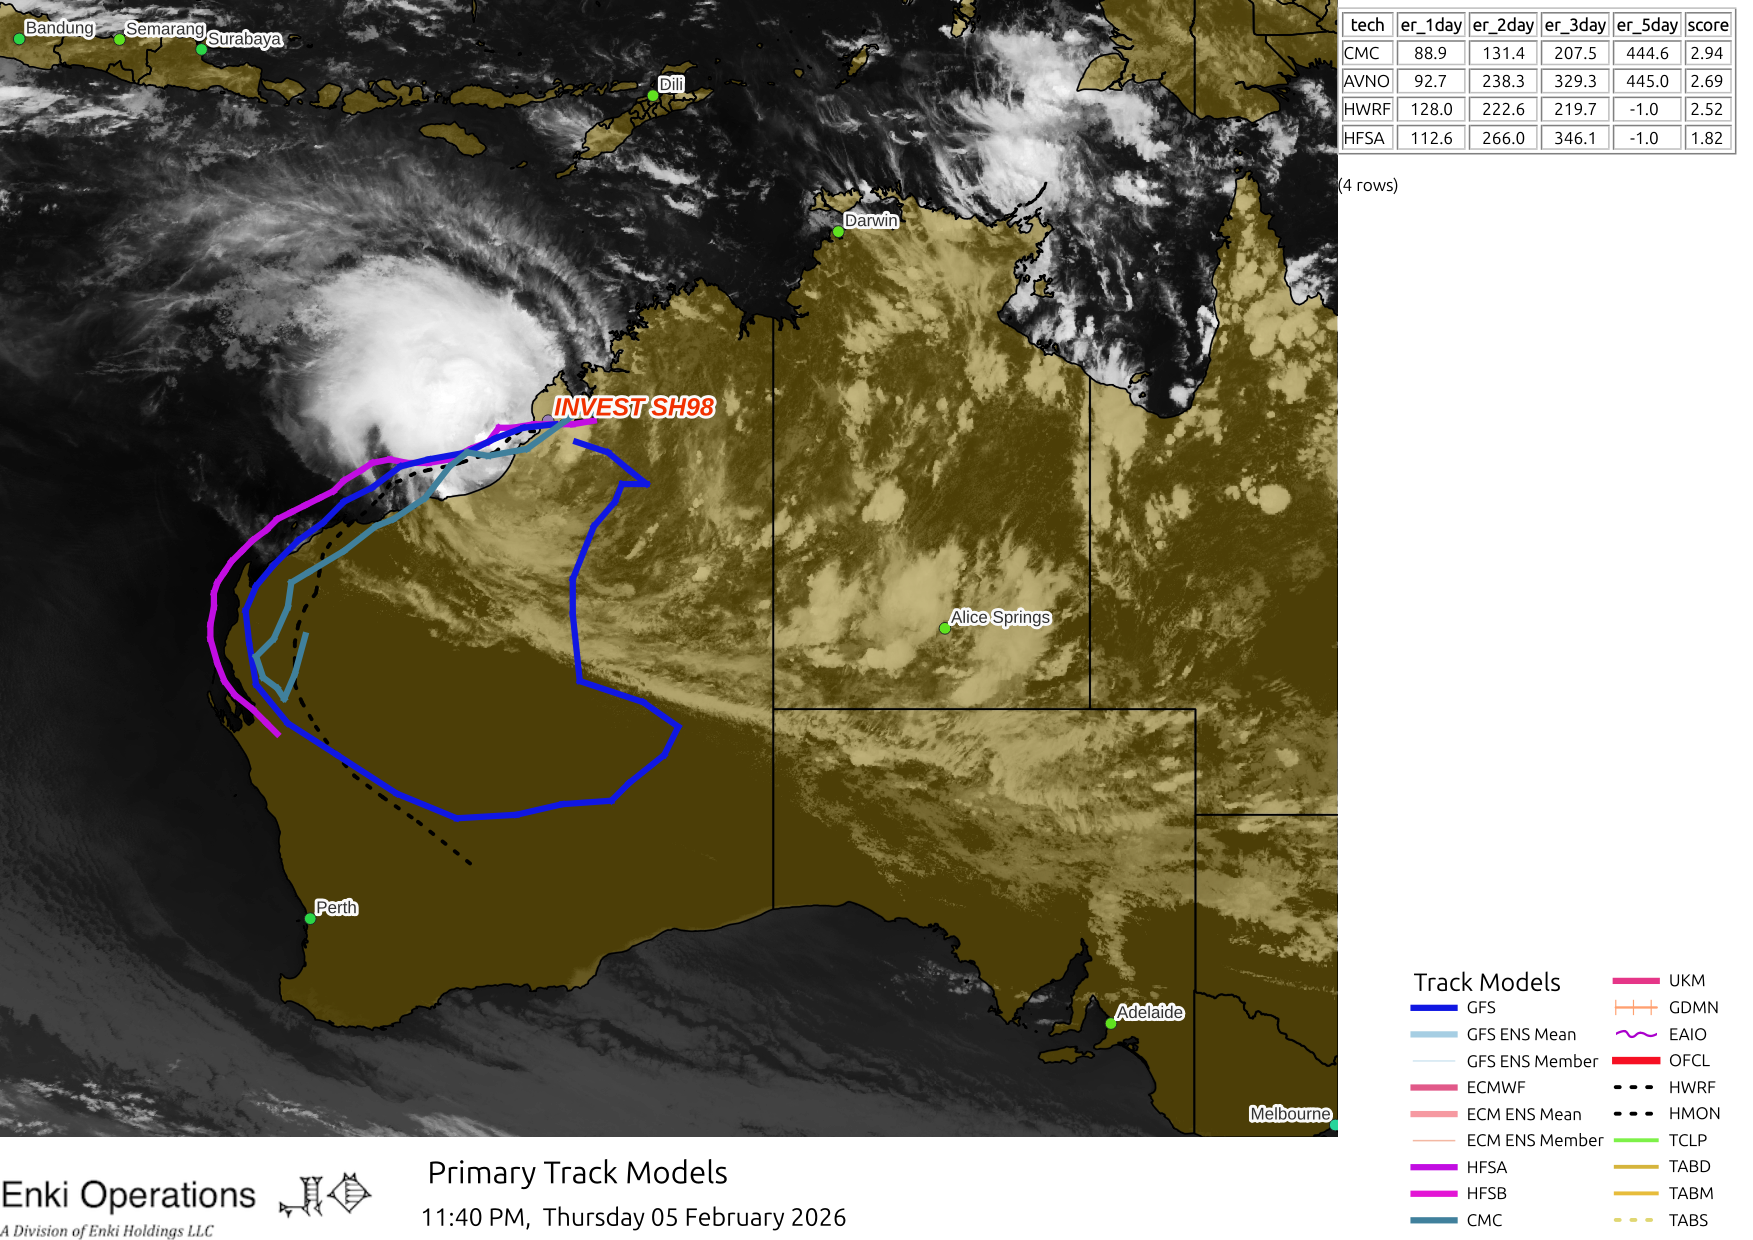 |
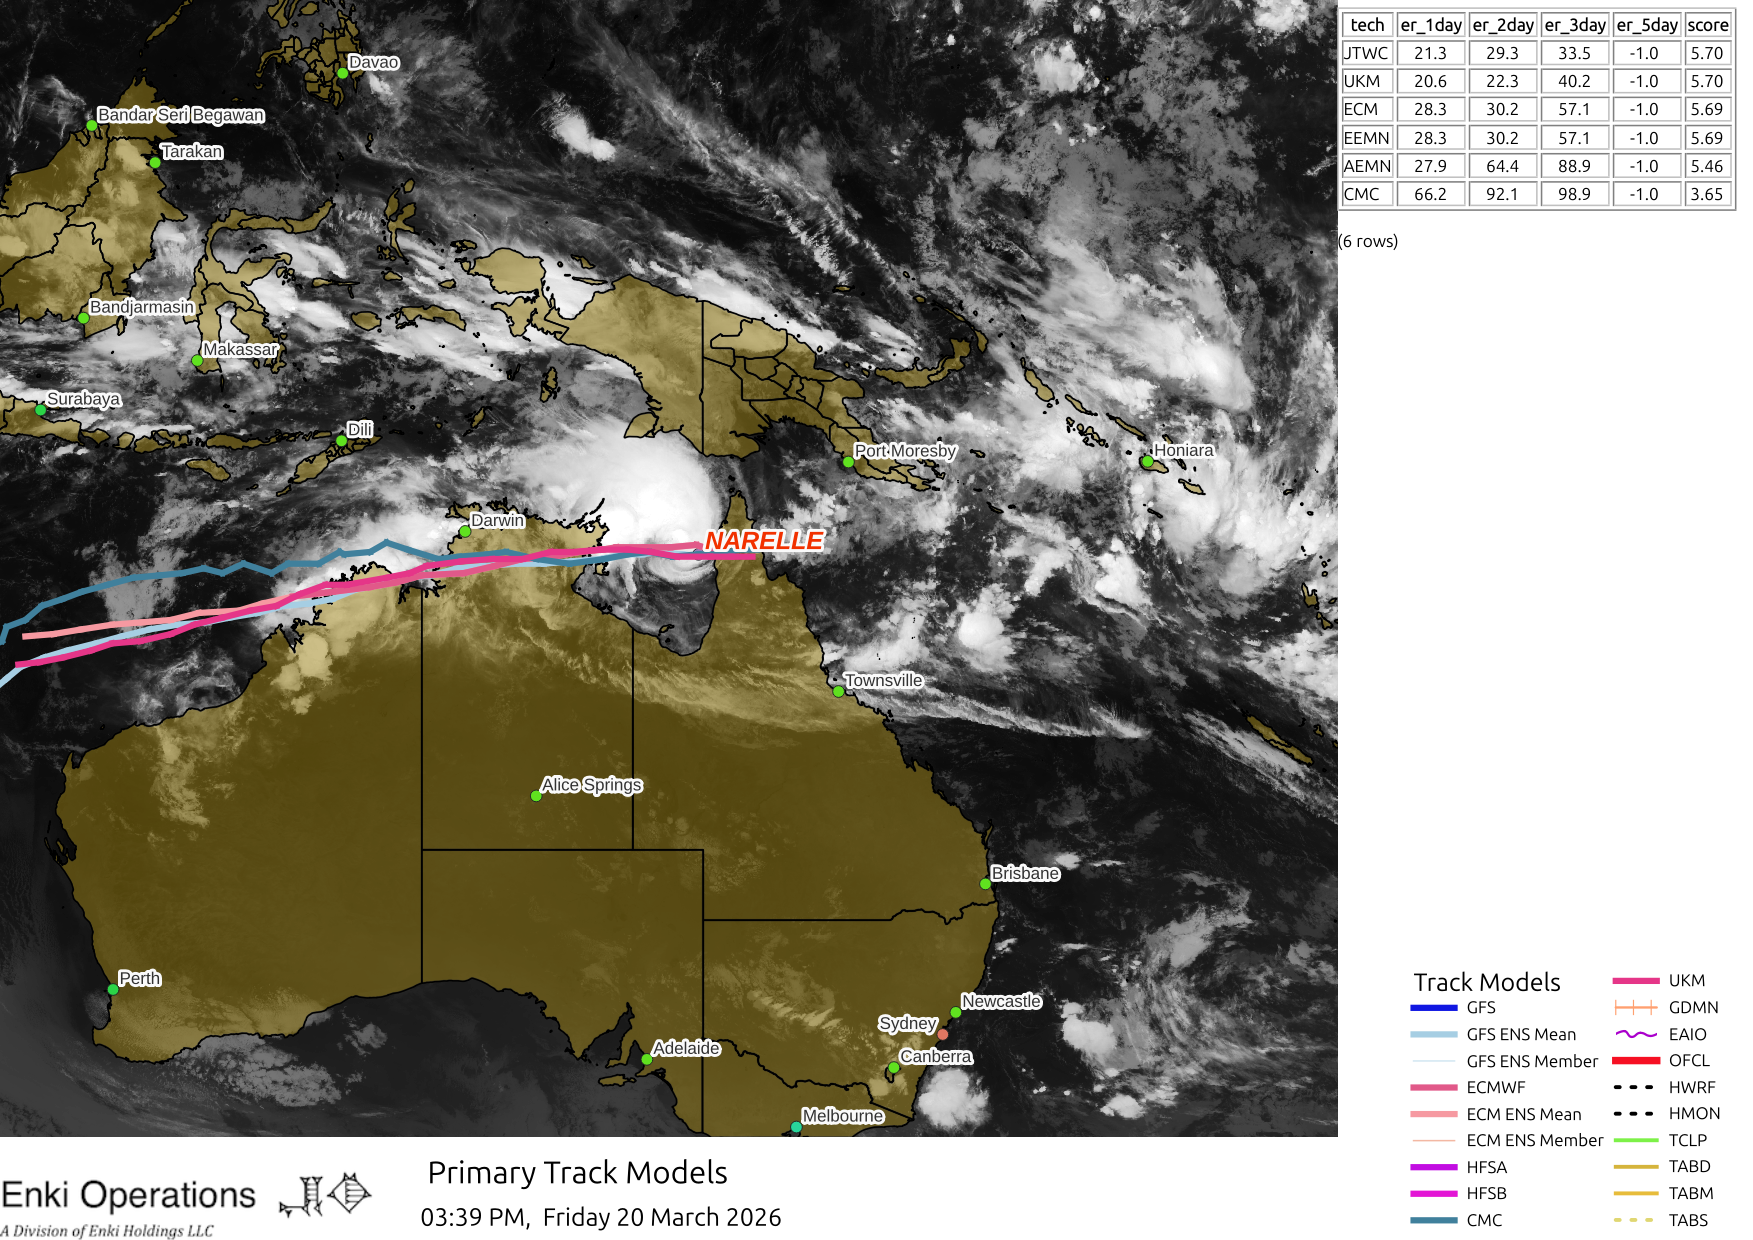
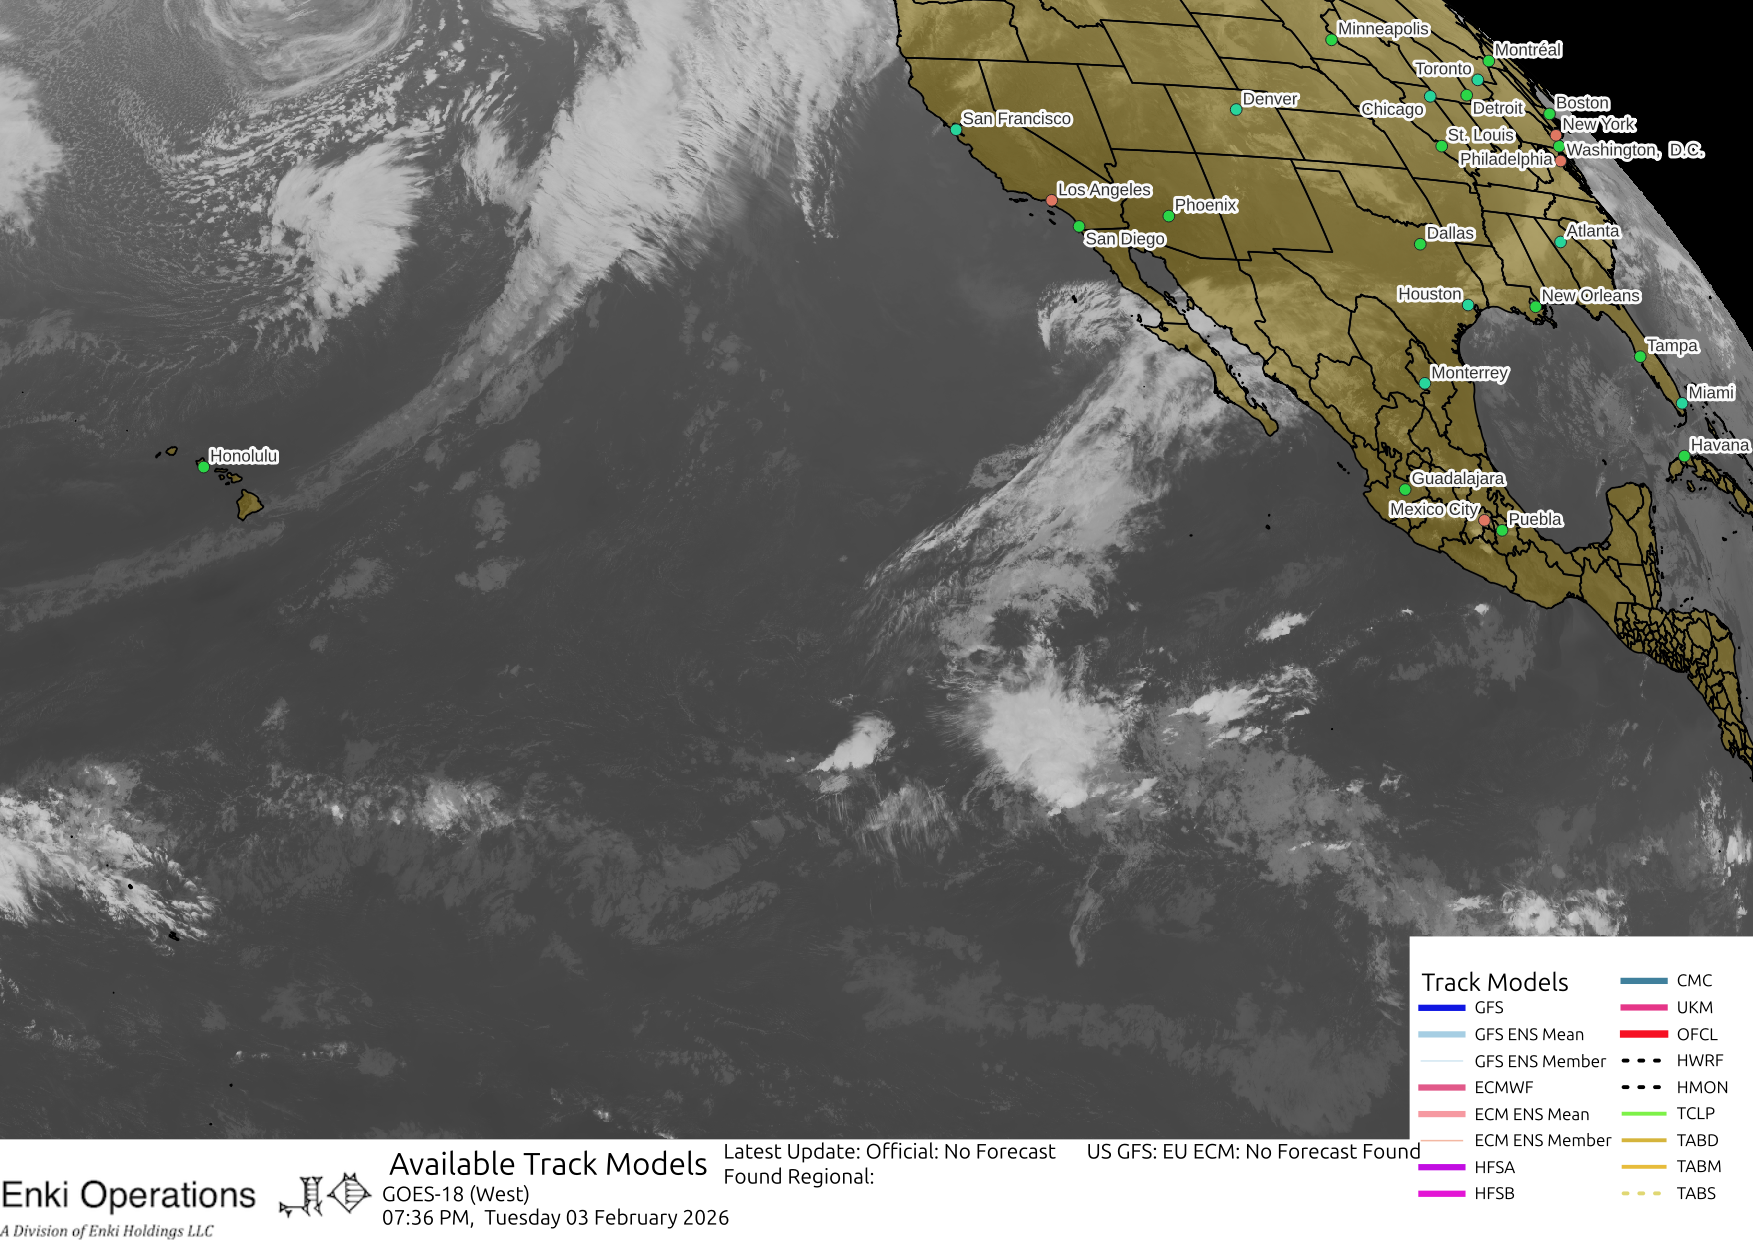
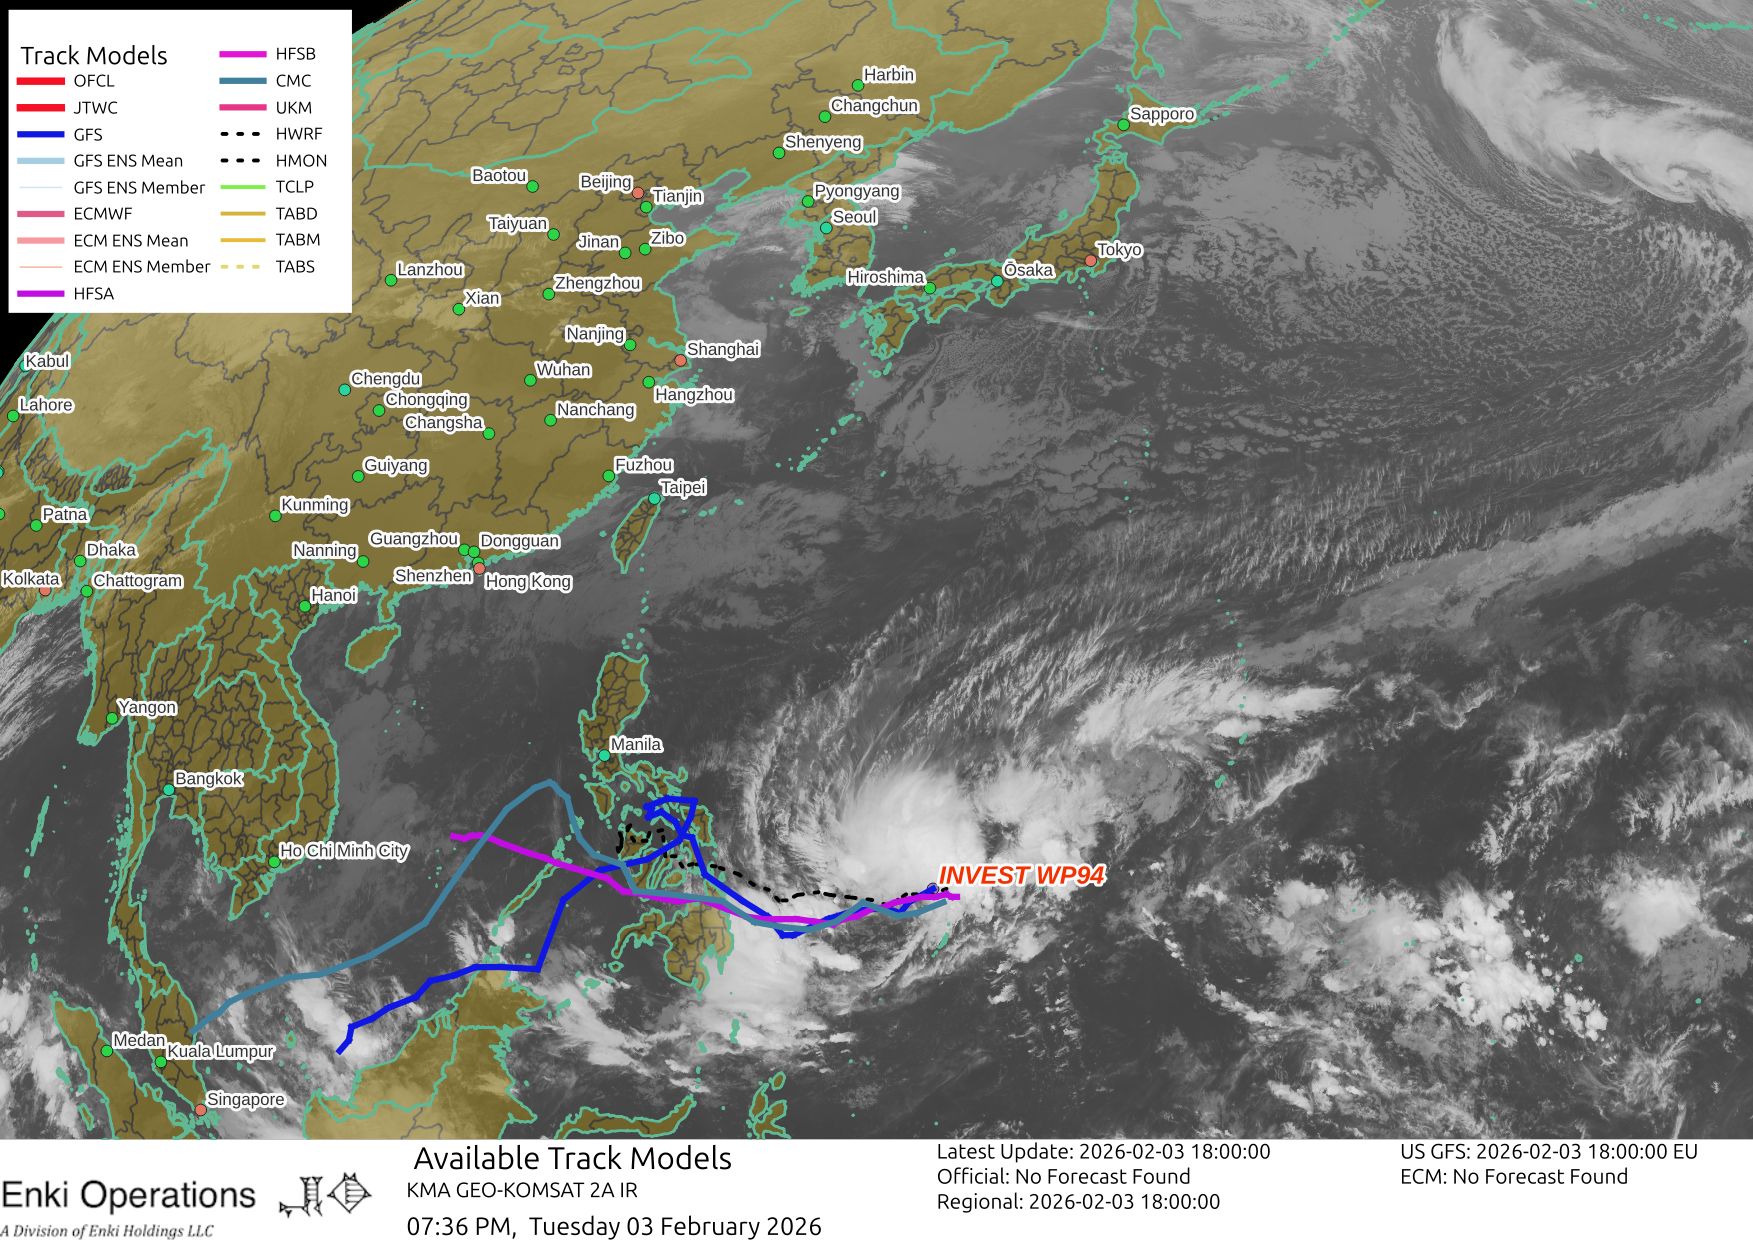
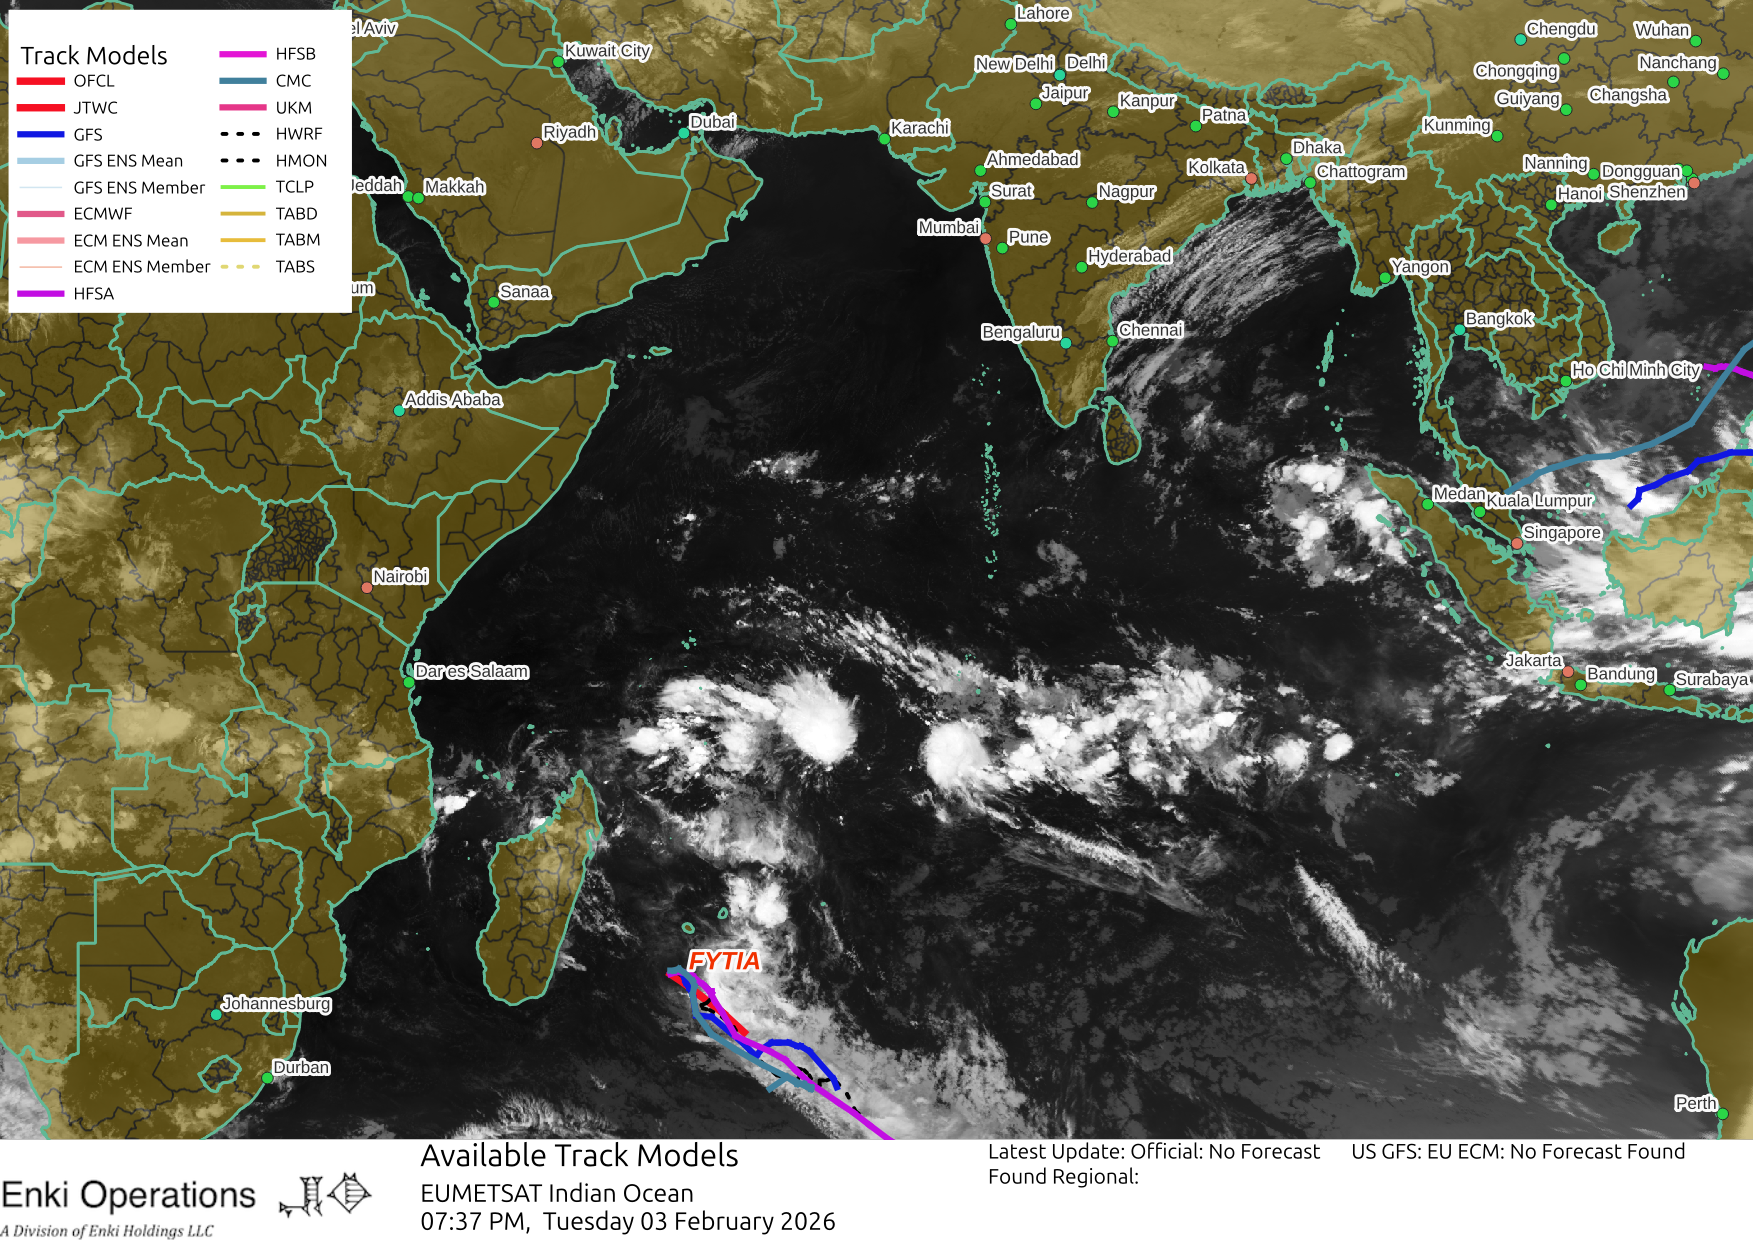
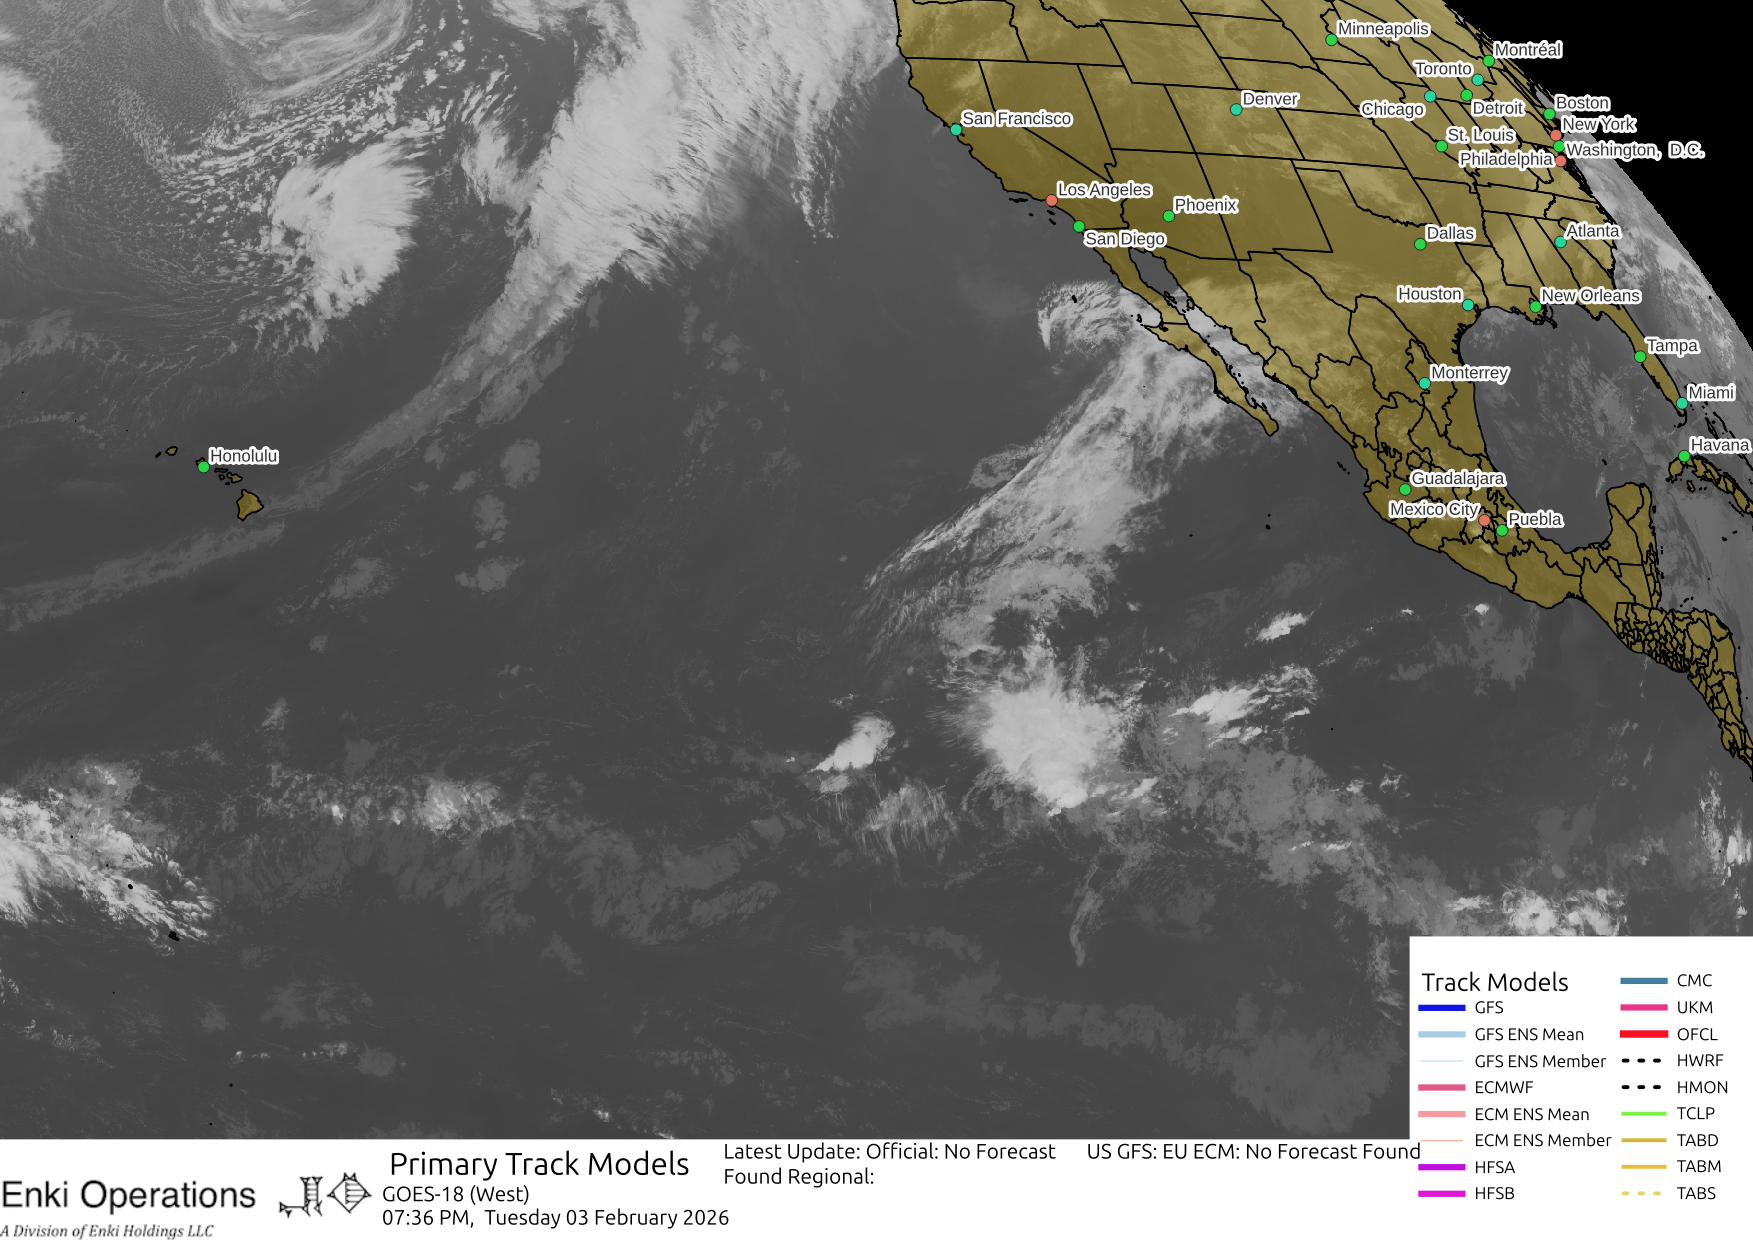
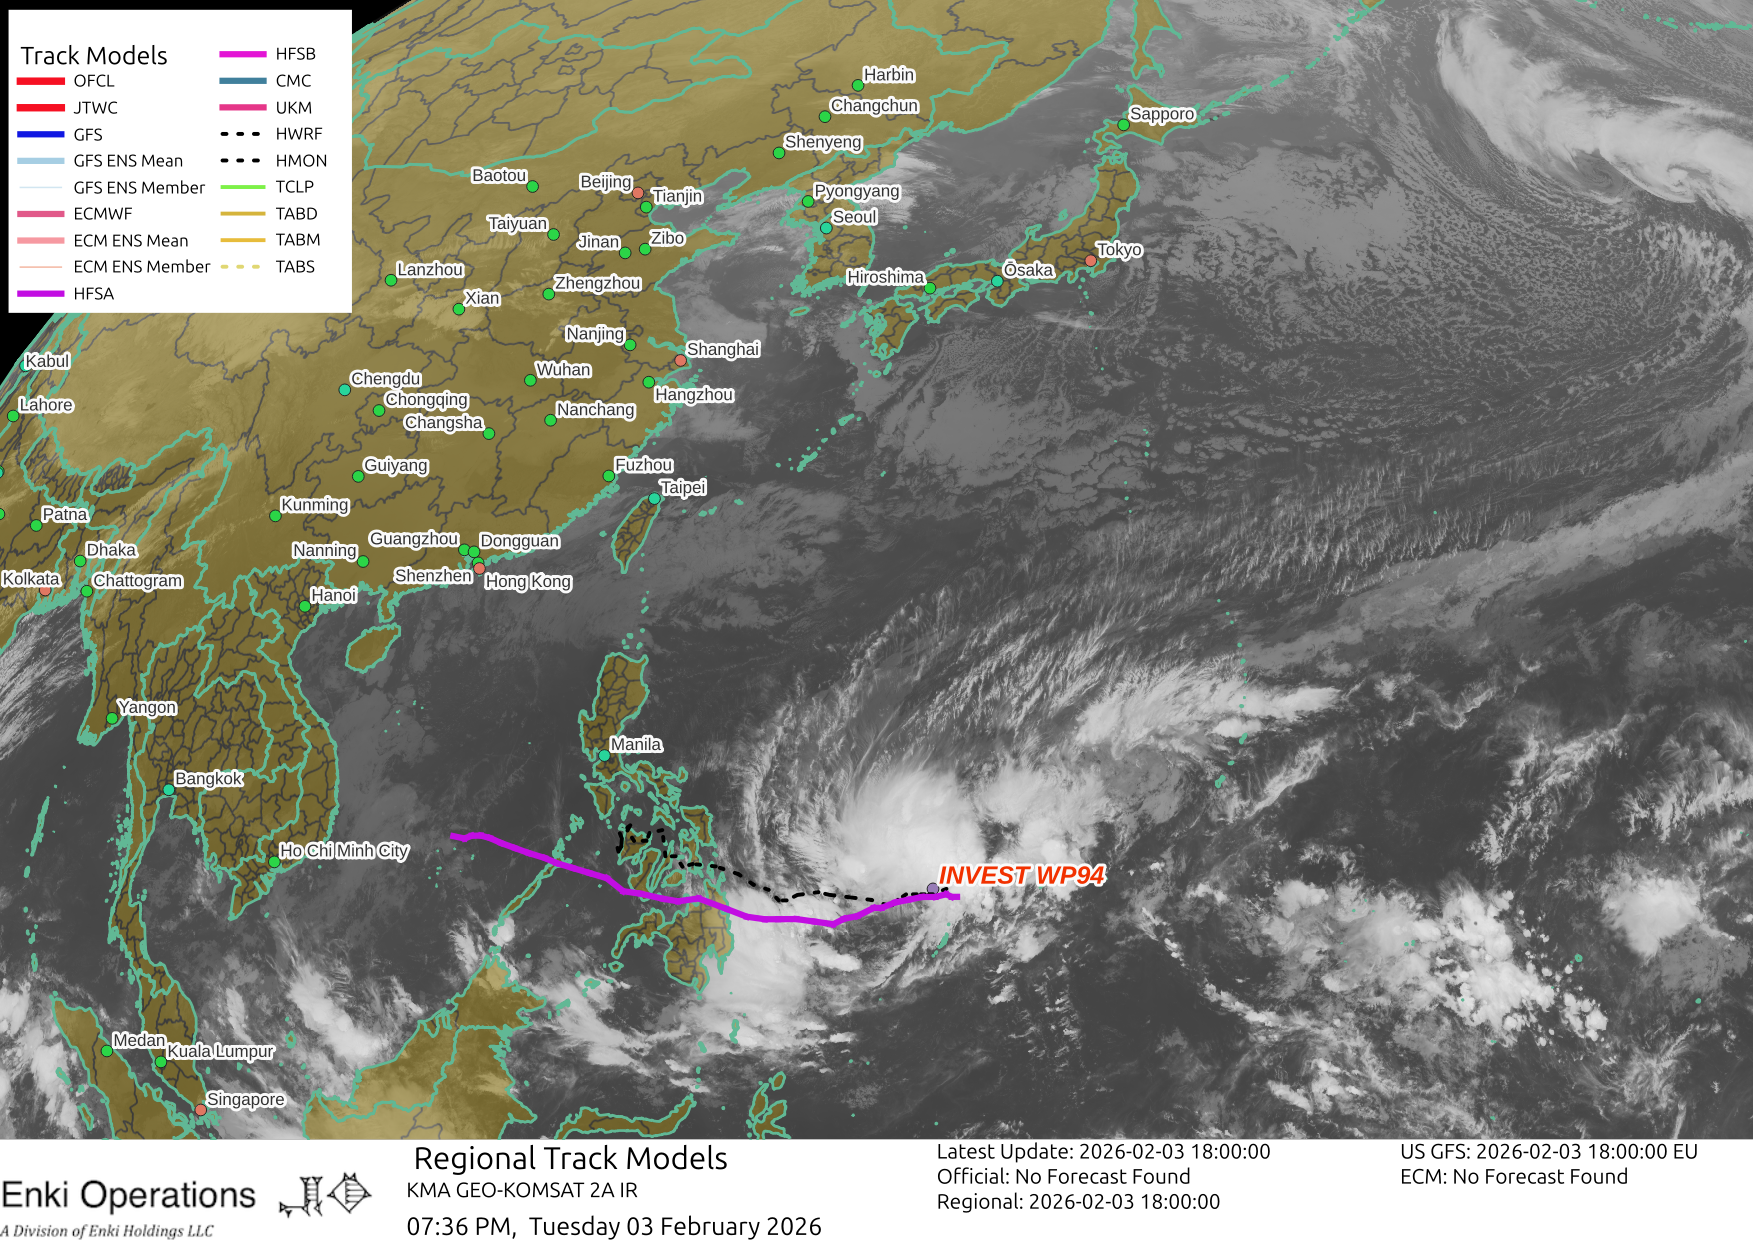
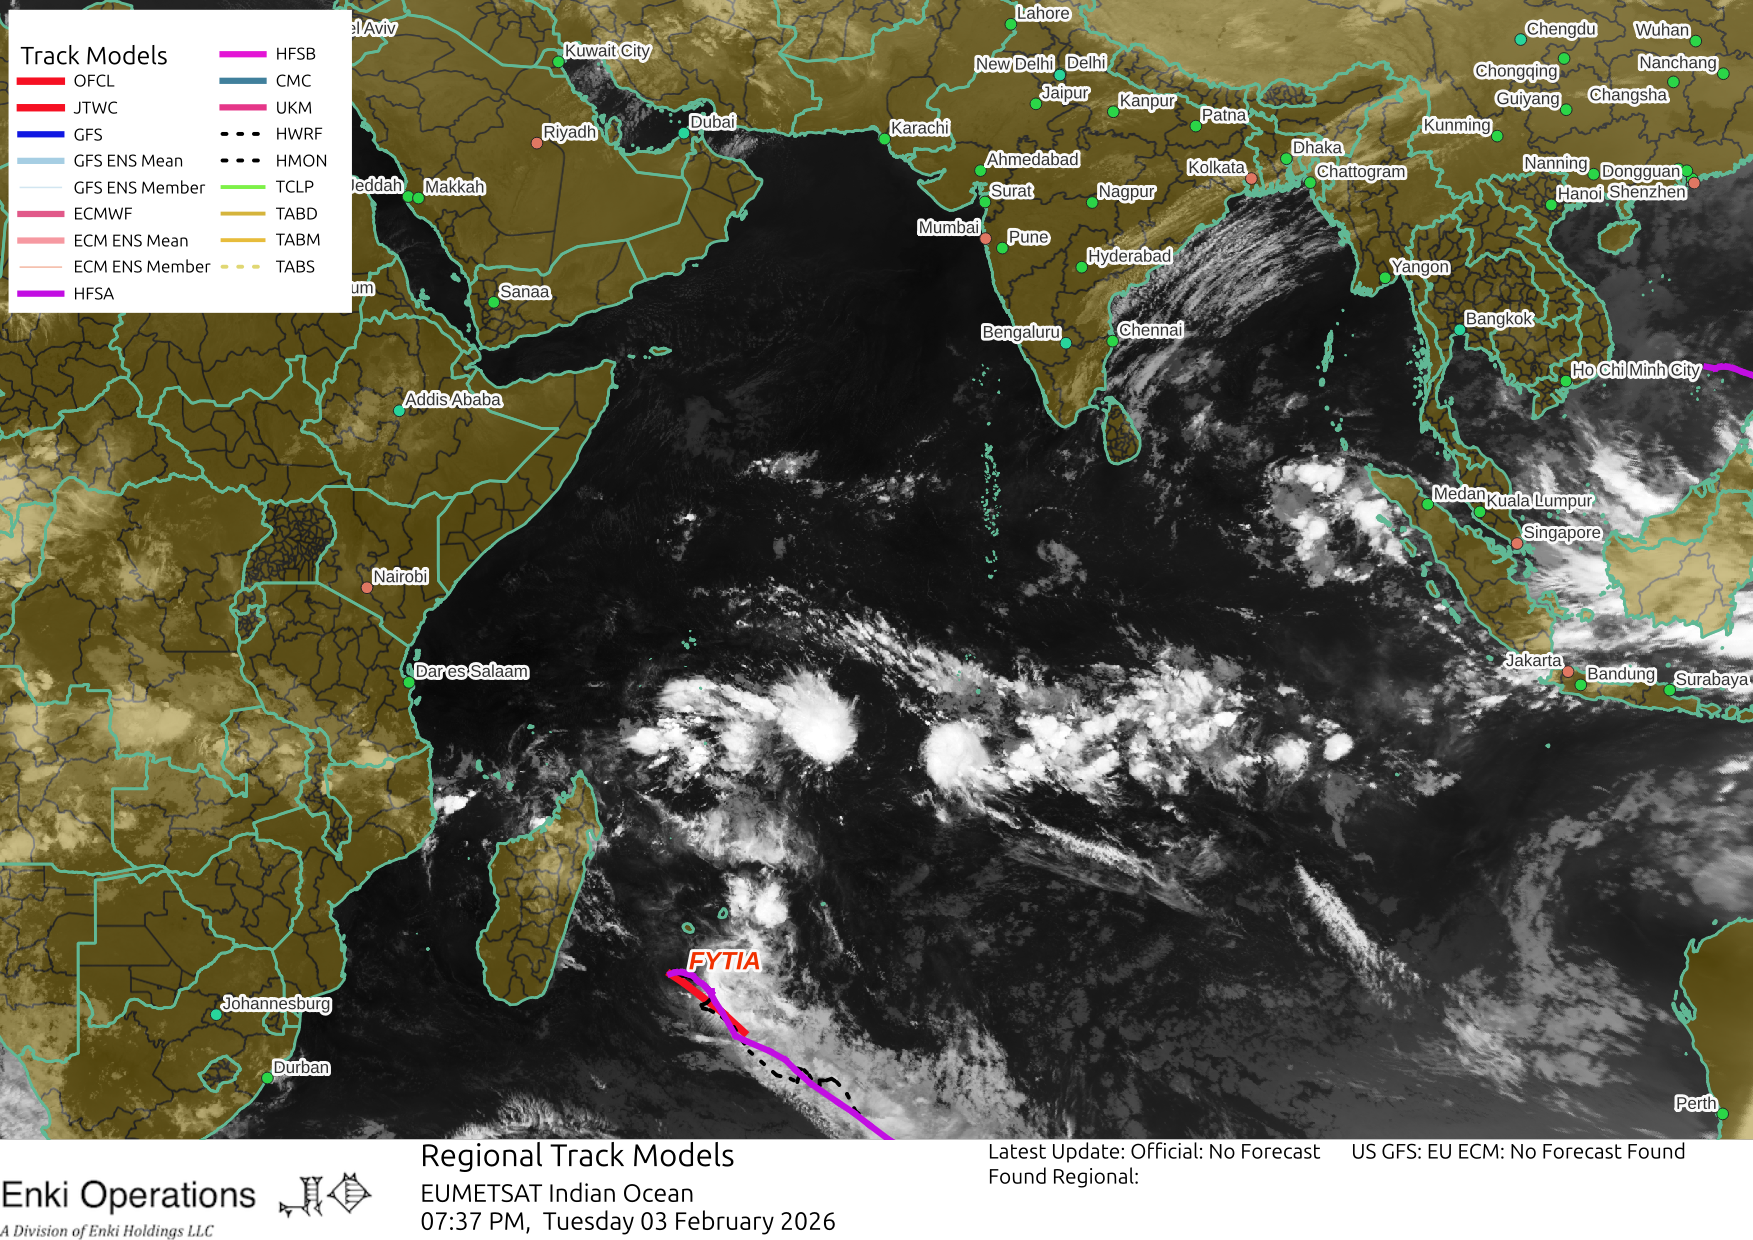
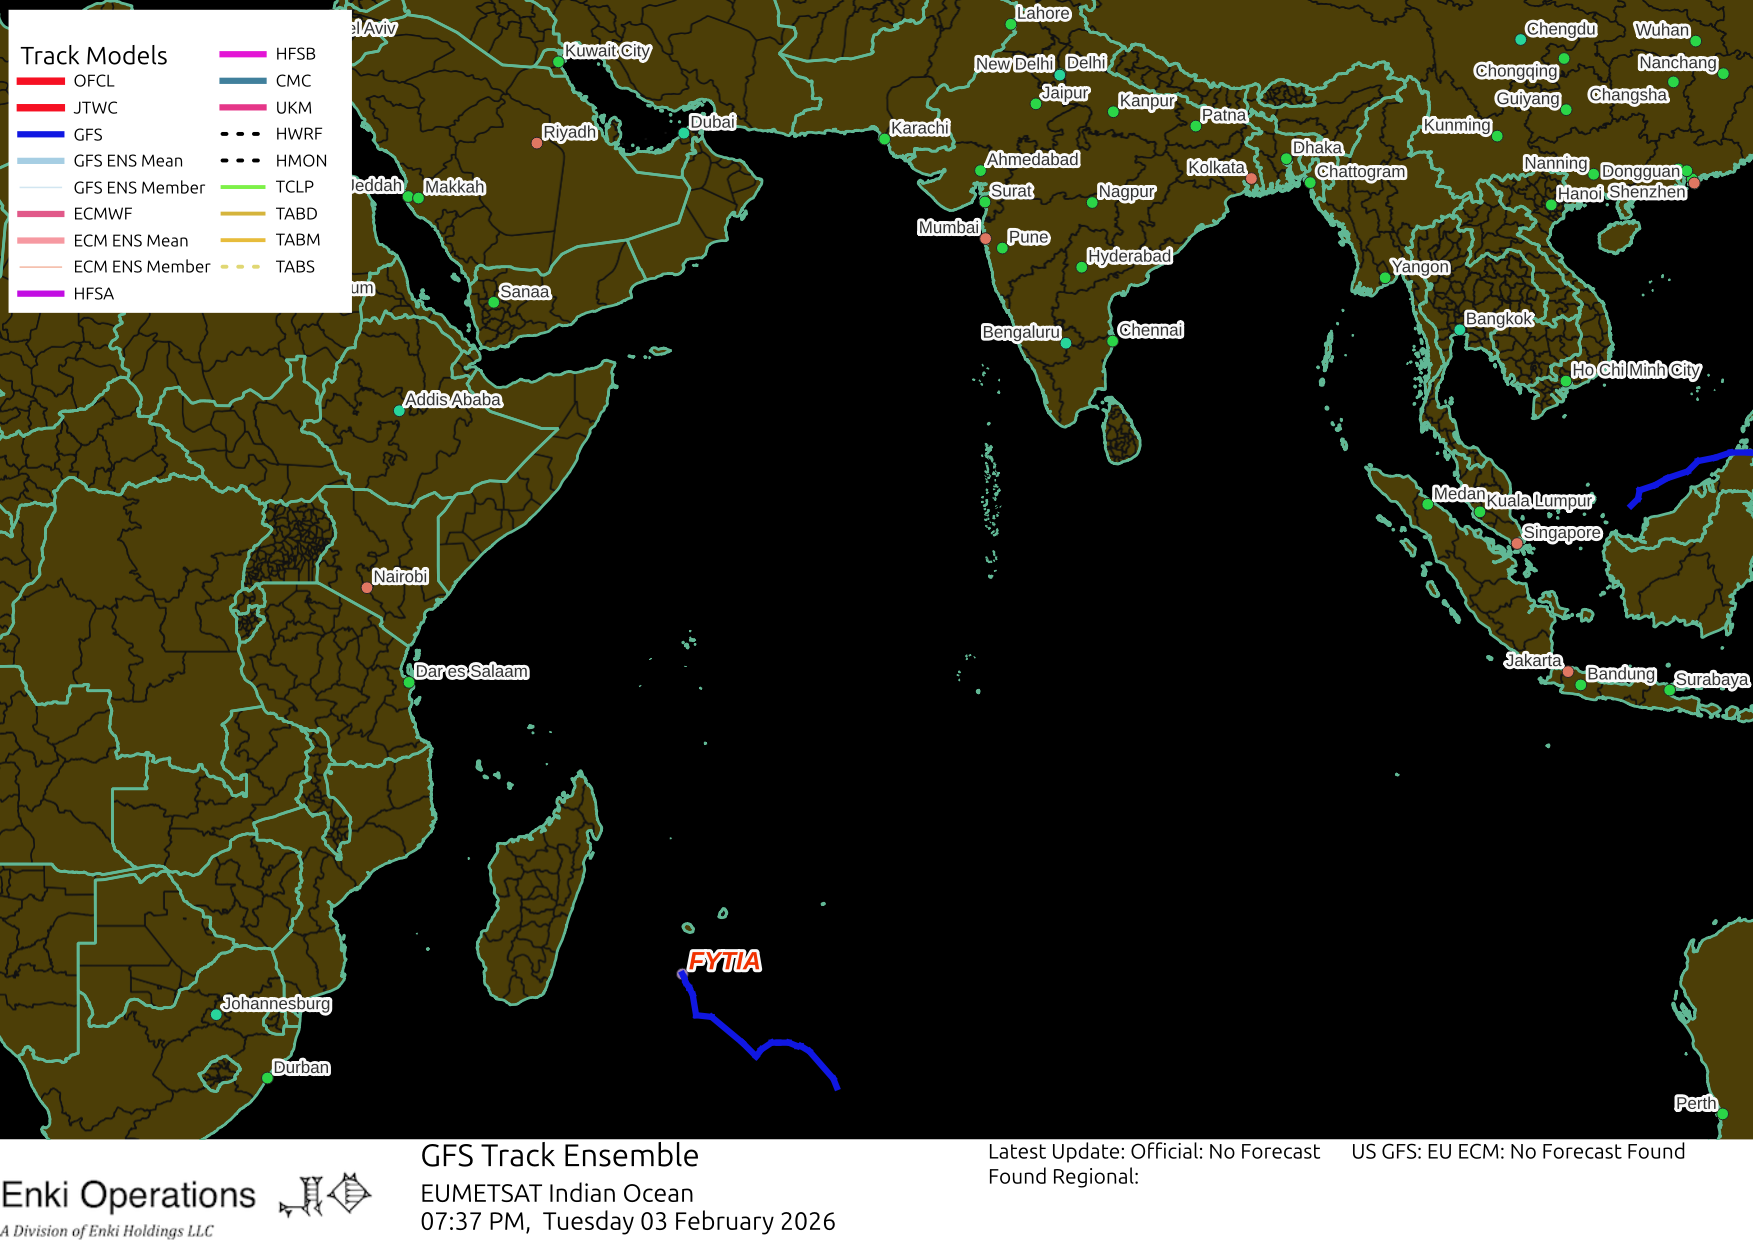
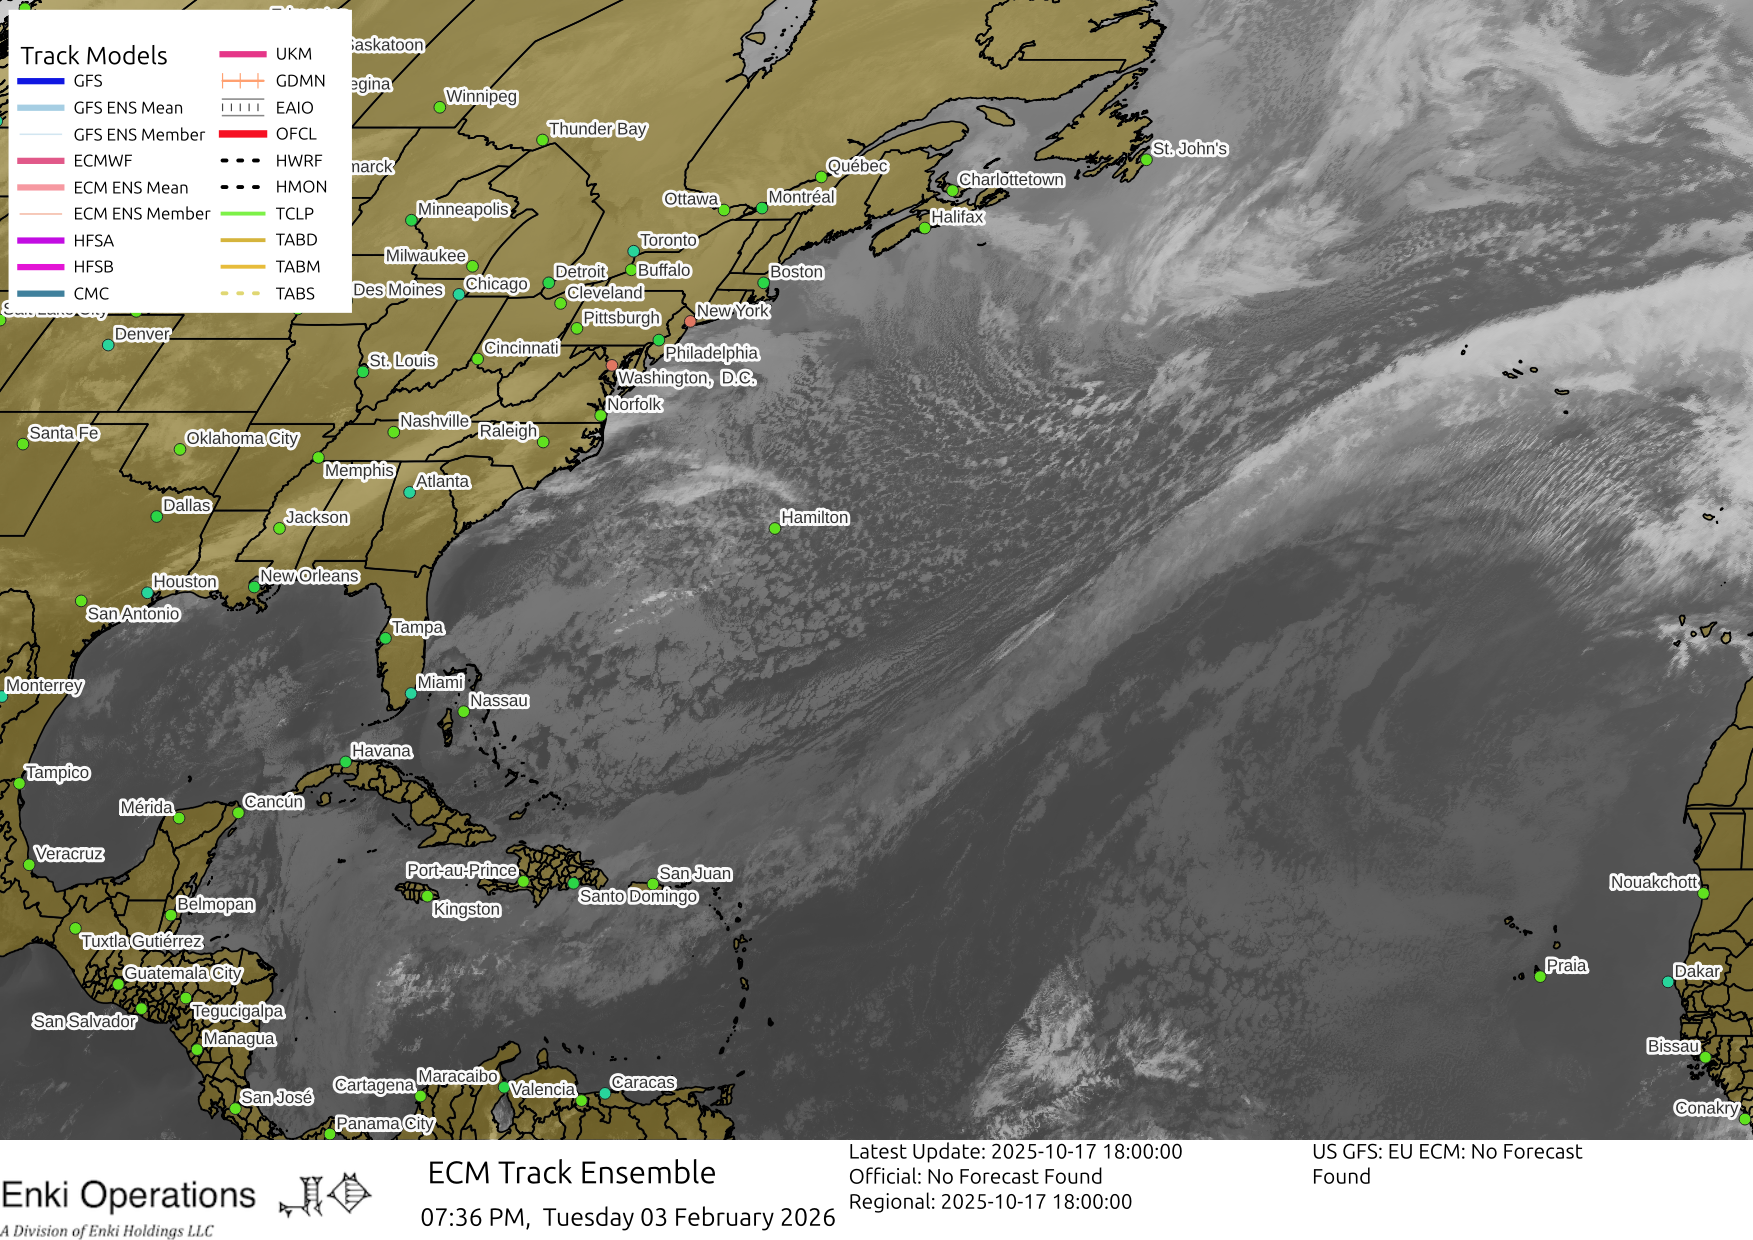
These are the infamous spaghetti model maps showing the tracks generated by various computer models. Five sets of maps are shown here, one for each major hurricane/tropical cyclone basin. The first set are all of the primary models. The second set are just the global forecast models (GFS, ECM, CMC, etc). The third are dedicated regional models such as the HFSA/B system, the older HWRF and HMON models, as well as Trajectory models derived from GFS. The green line (TCLP) is a statistical model that only uses the current position, heading, and historical storm tracks to do a forecast. This tells you what storms in the past have done, and is an indication of how difficult the forecast is for this storm (if the dynamical models deviate a lot from the green line, that means the storm is more difficult to forecast than if they are going the same general direction). The final two sets of maps show the ensemble runs for the GFS and ECM models. These are simulations that have different starting condtions to provide an idea of how much uncertainty there is in the forecast.
| Atlantic | East Pacific | West Pacific | Indian Ocean | |
|---|---|---|---|---|
| All Models |

|
|
|
|
| Global Models |

|
|

|

|
| Regional Models |

|

|
|
|
| US Global Forecast System |

|

|

|
|
| European Centre Model |
|

|

|

|
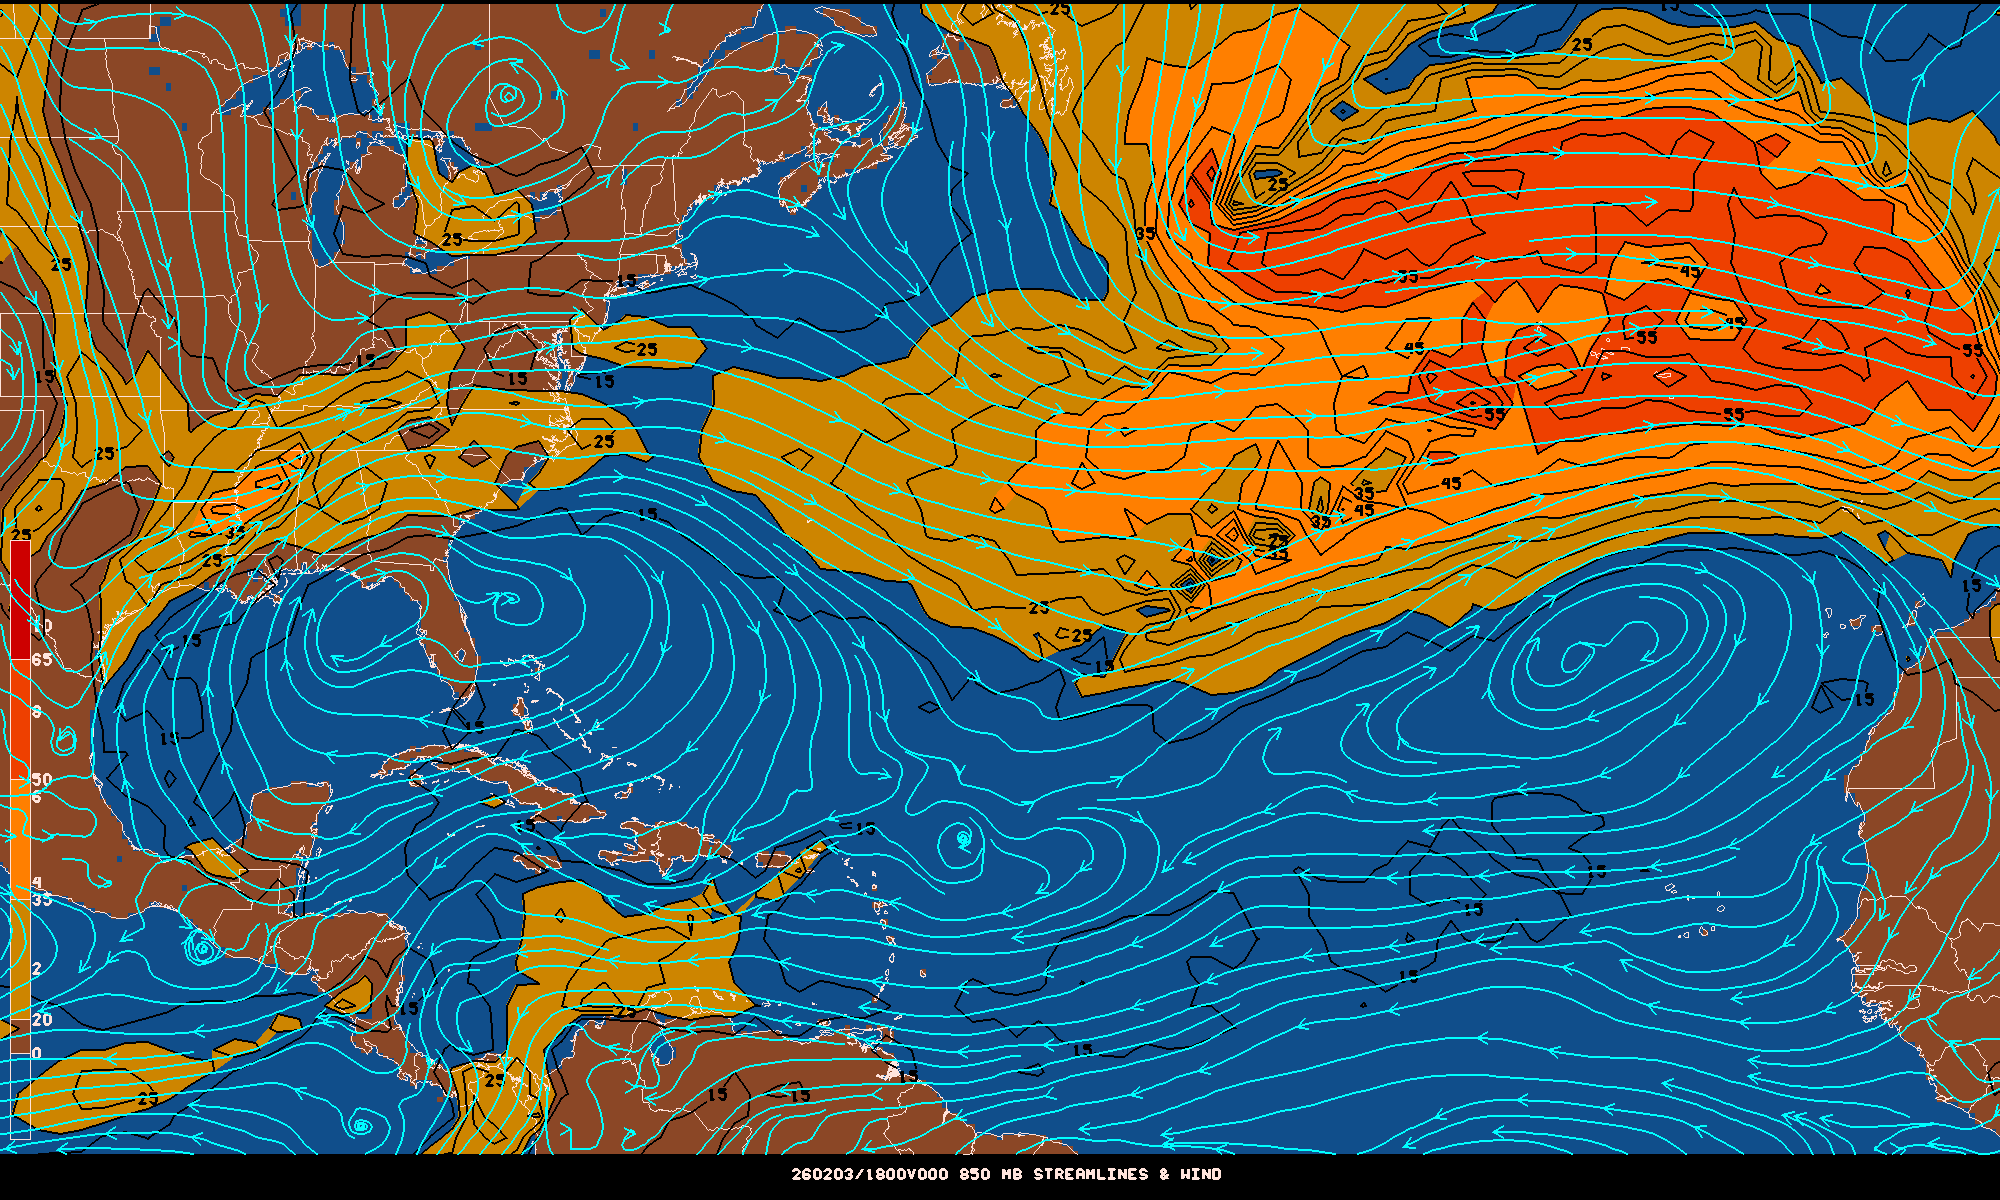
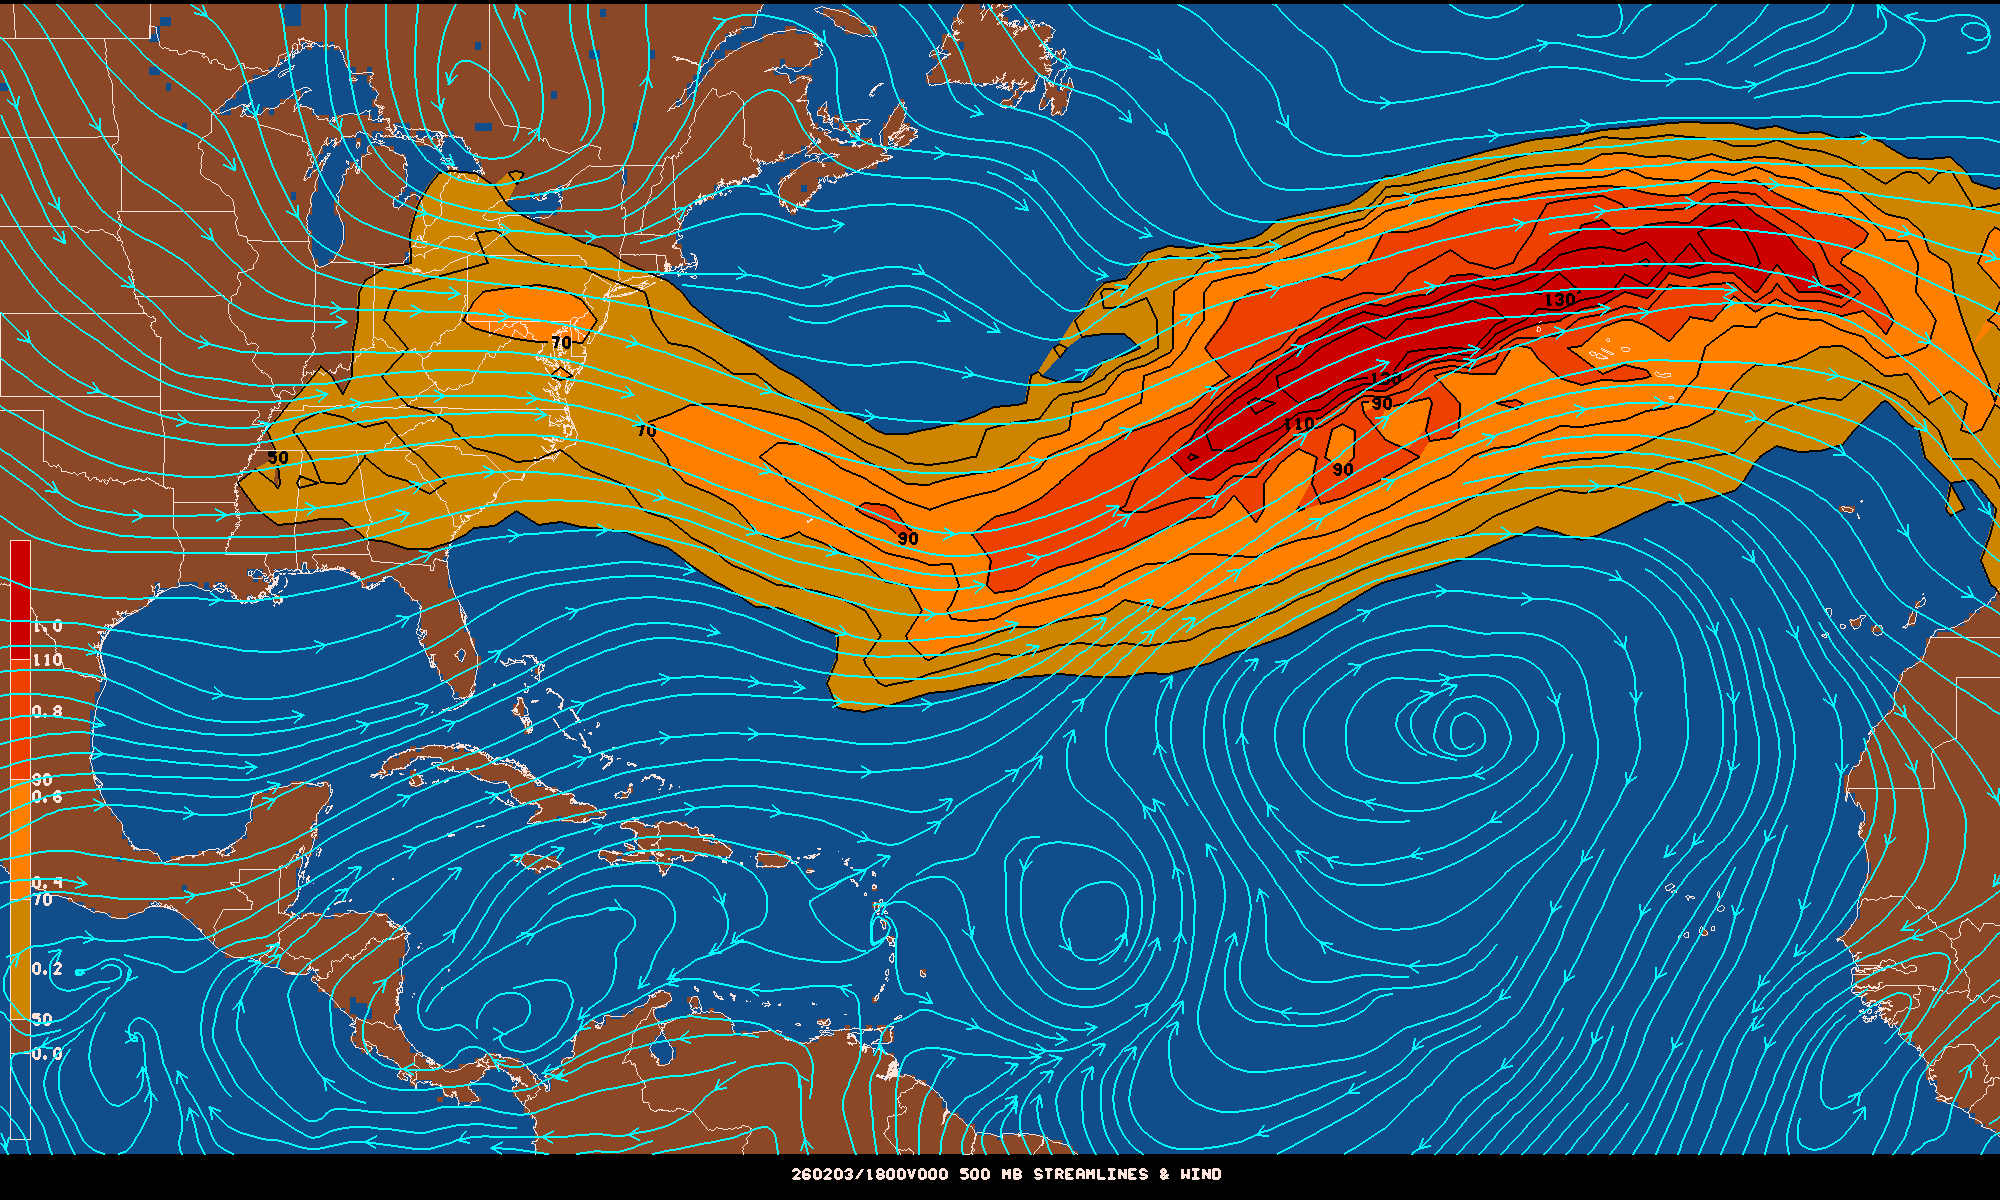
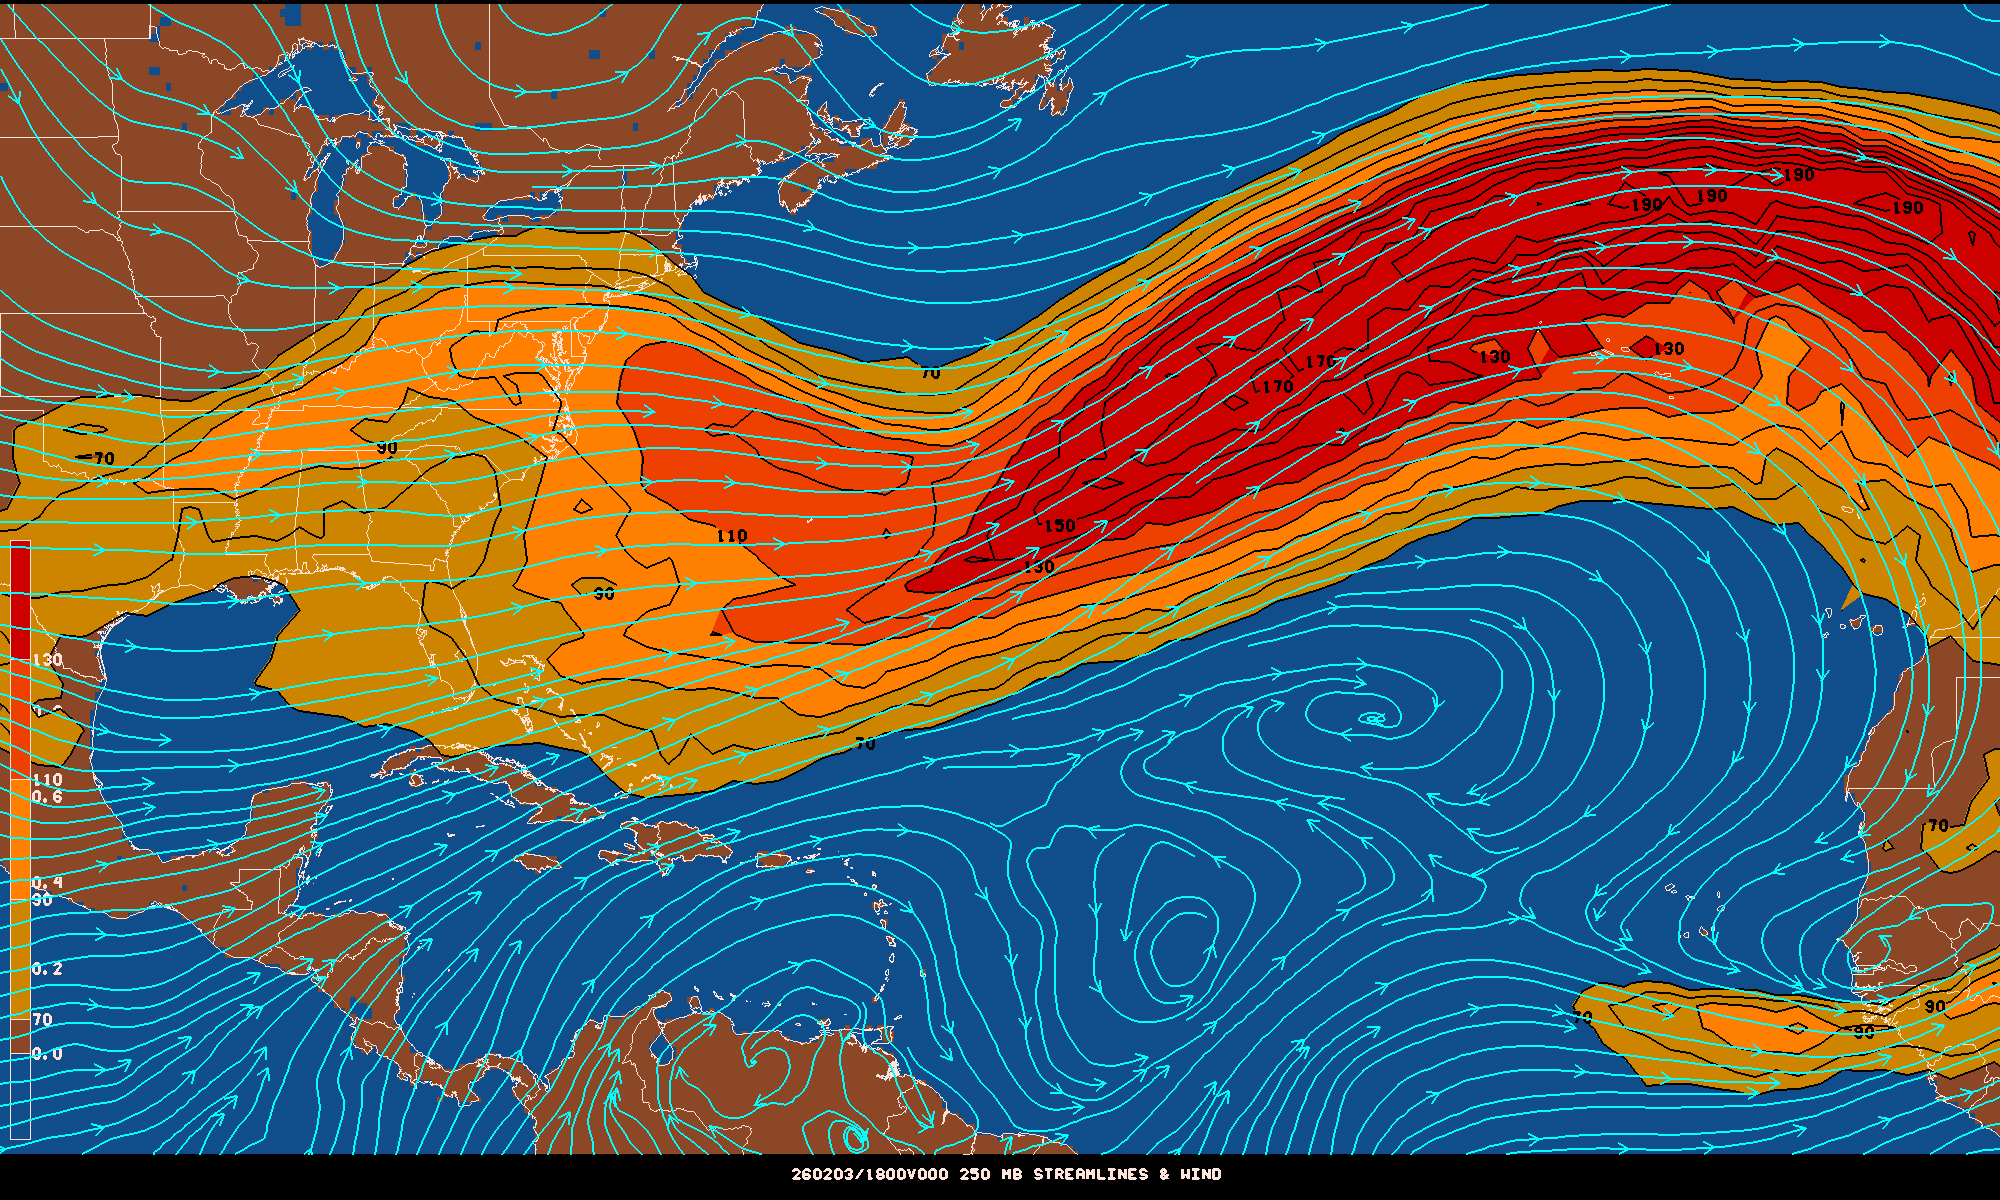
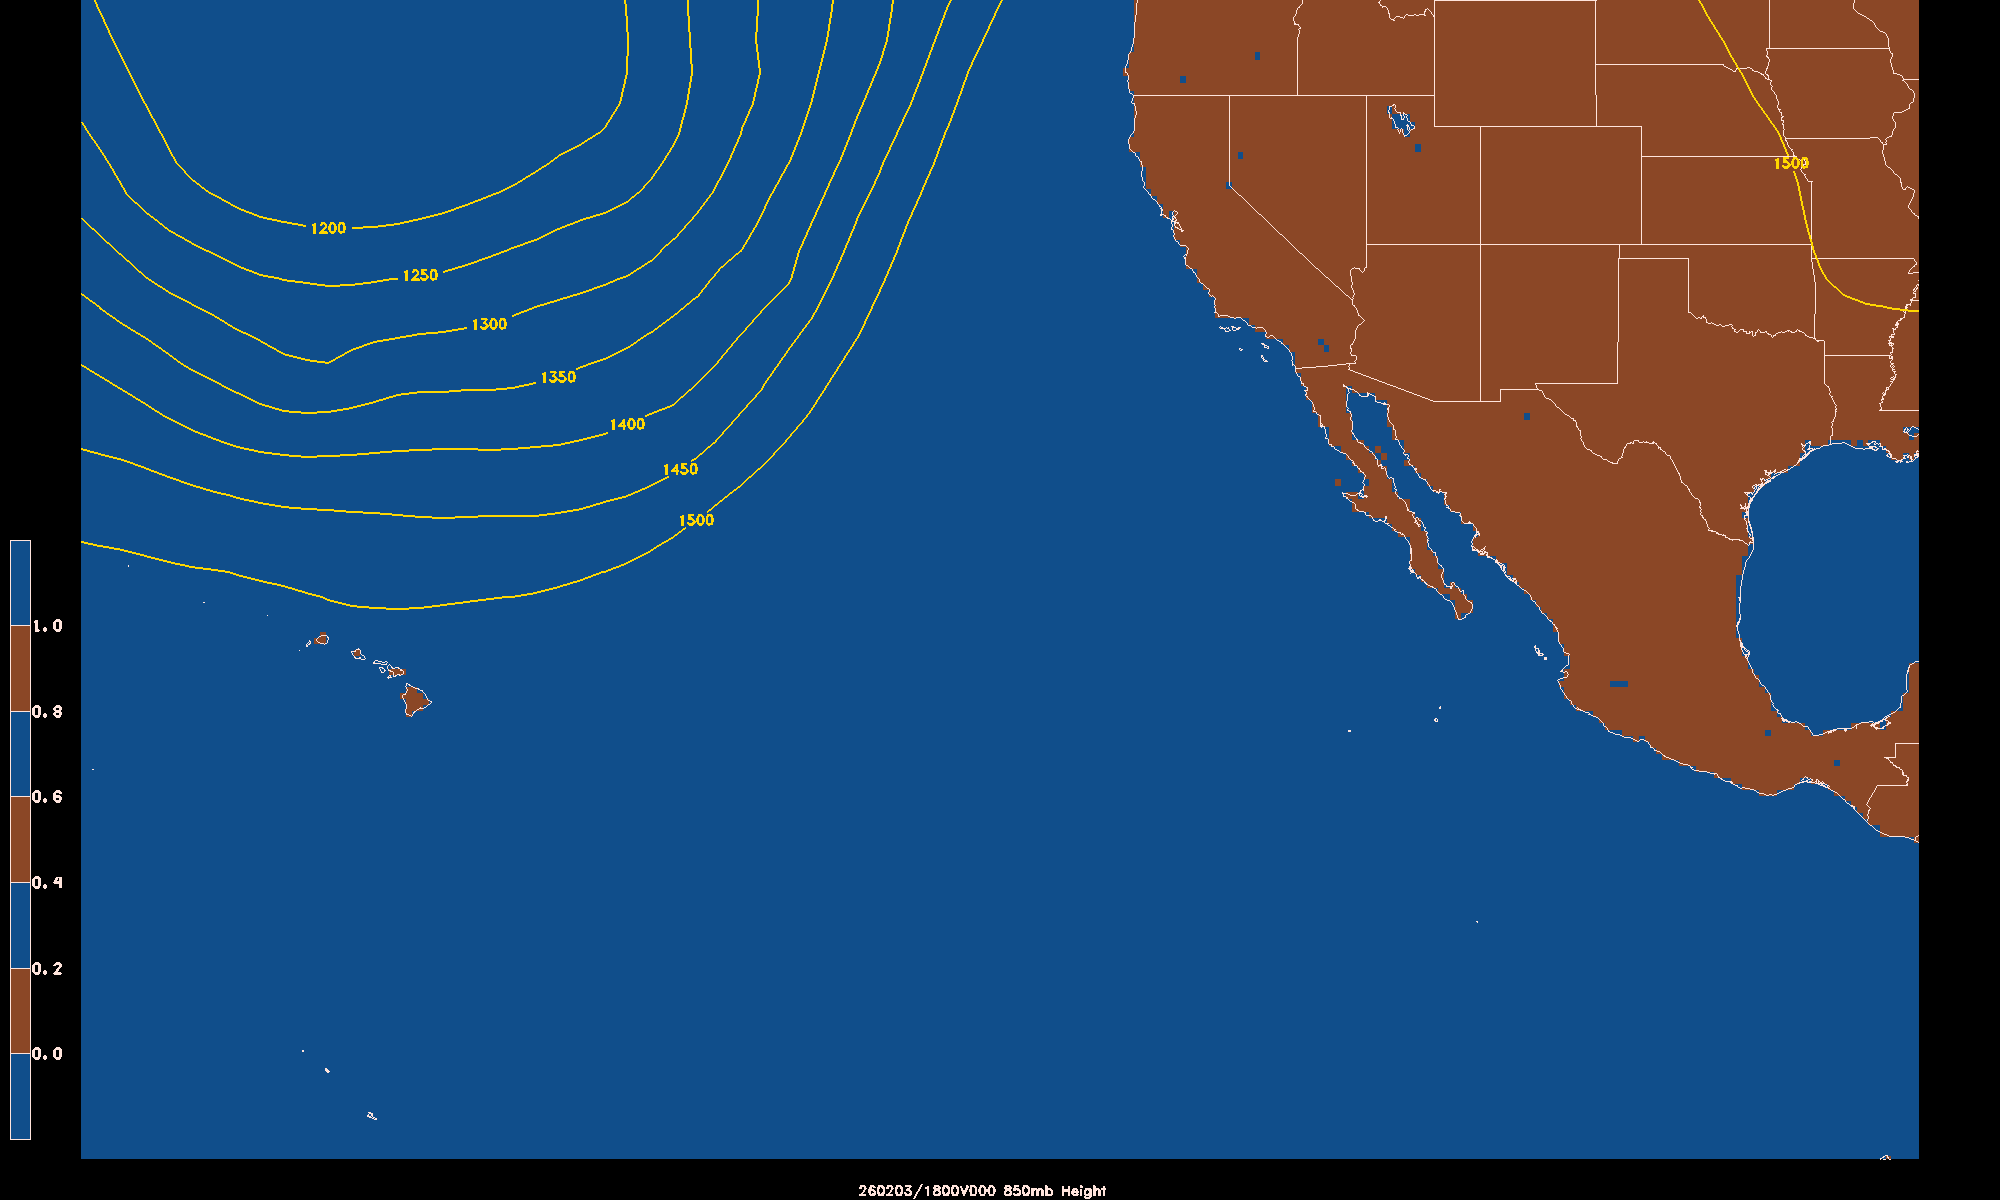
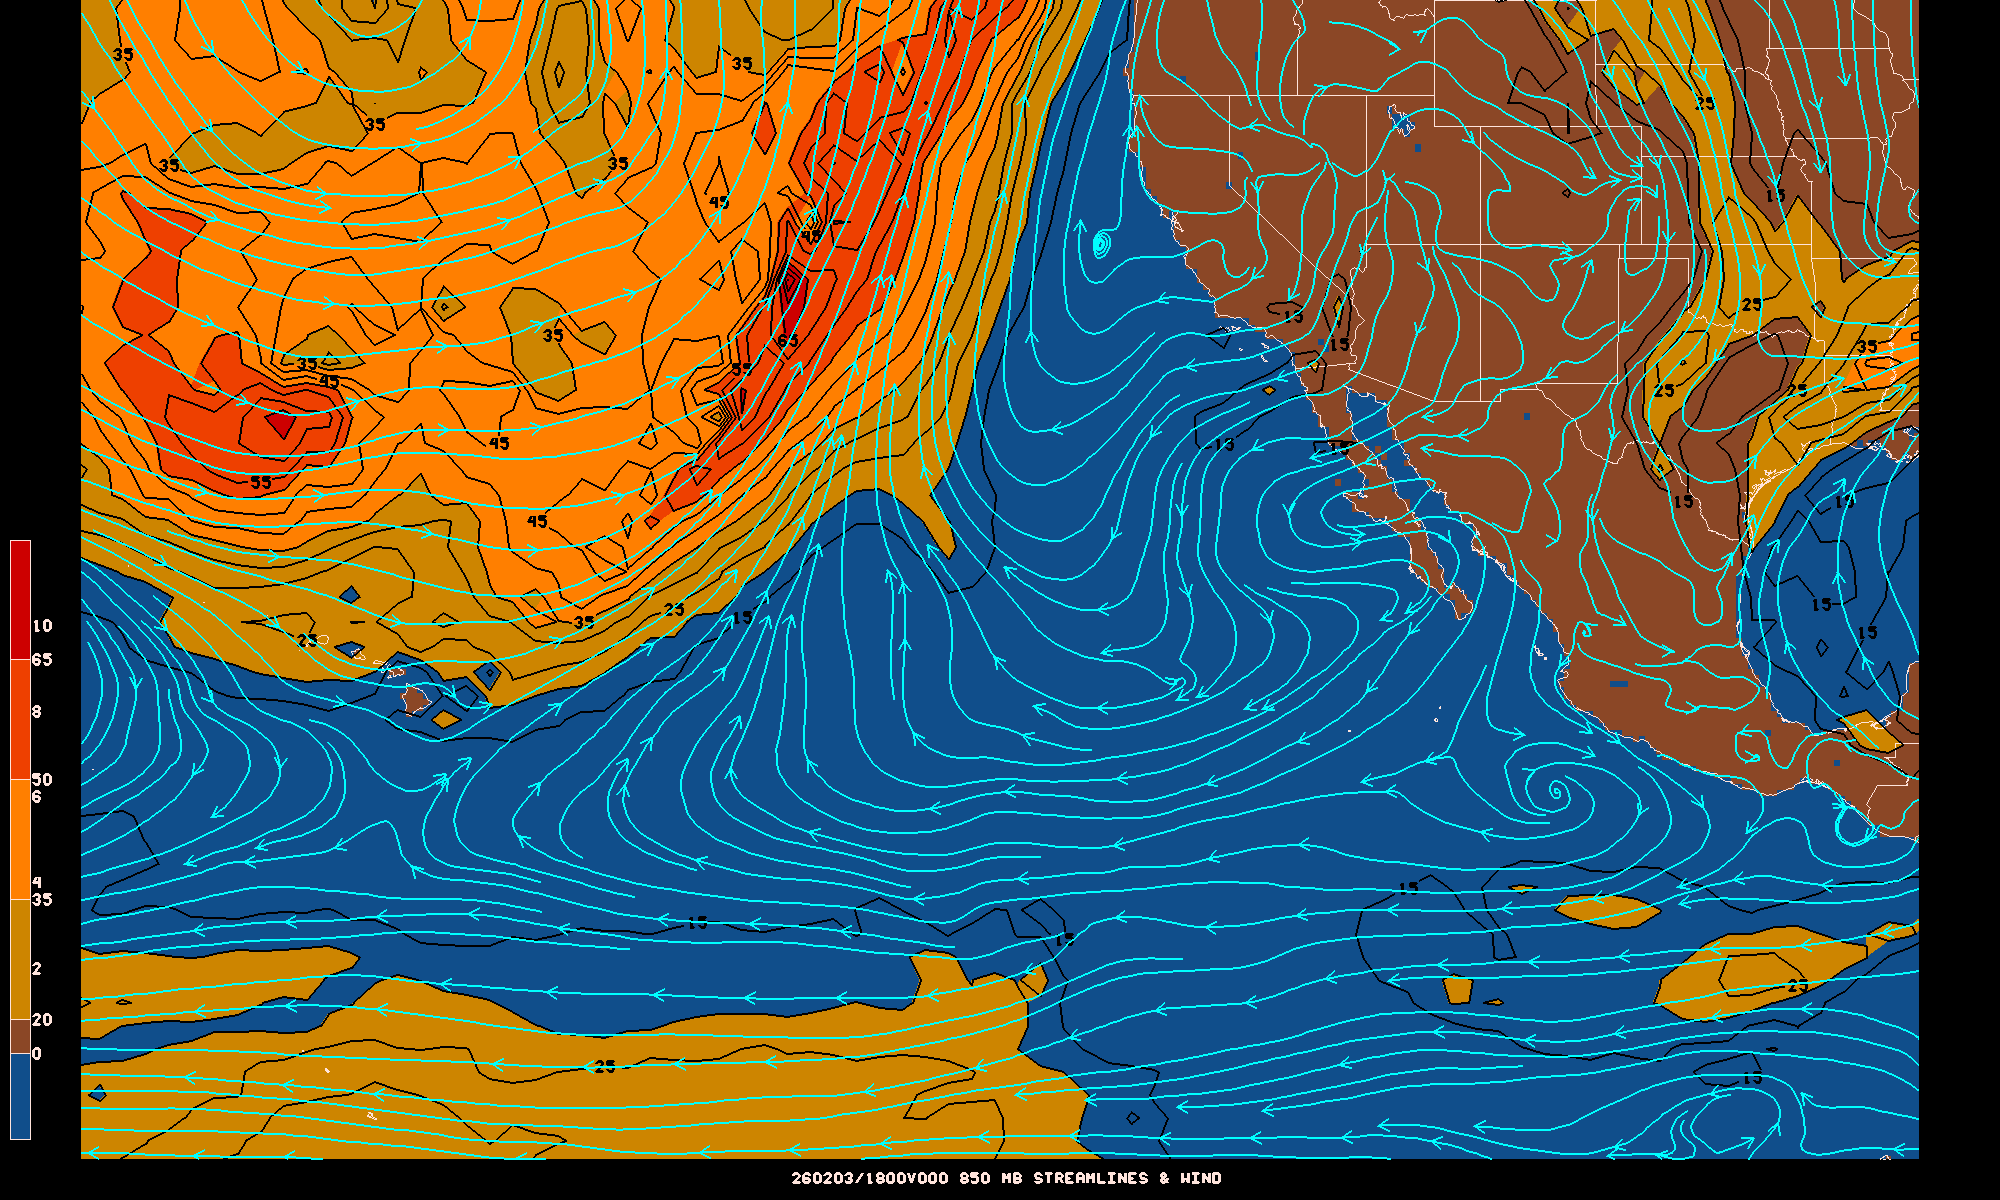
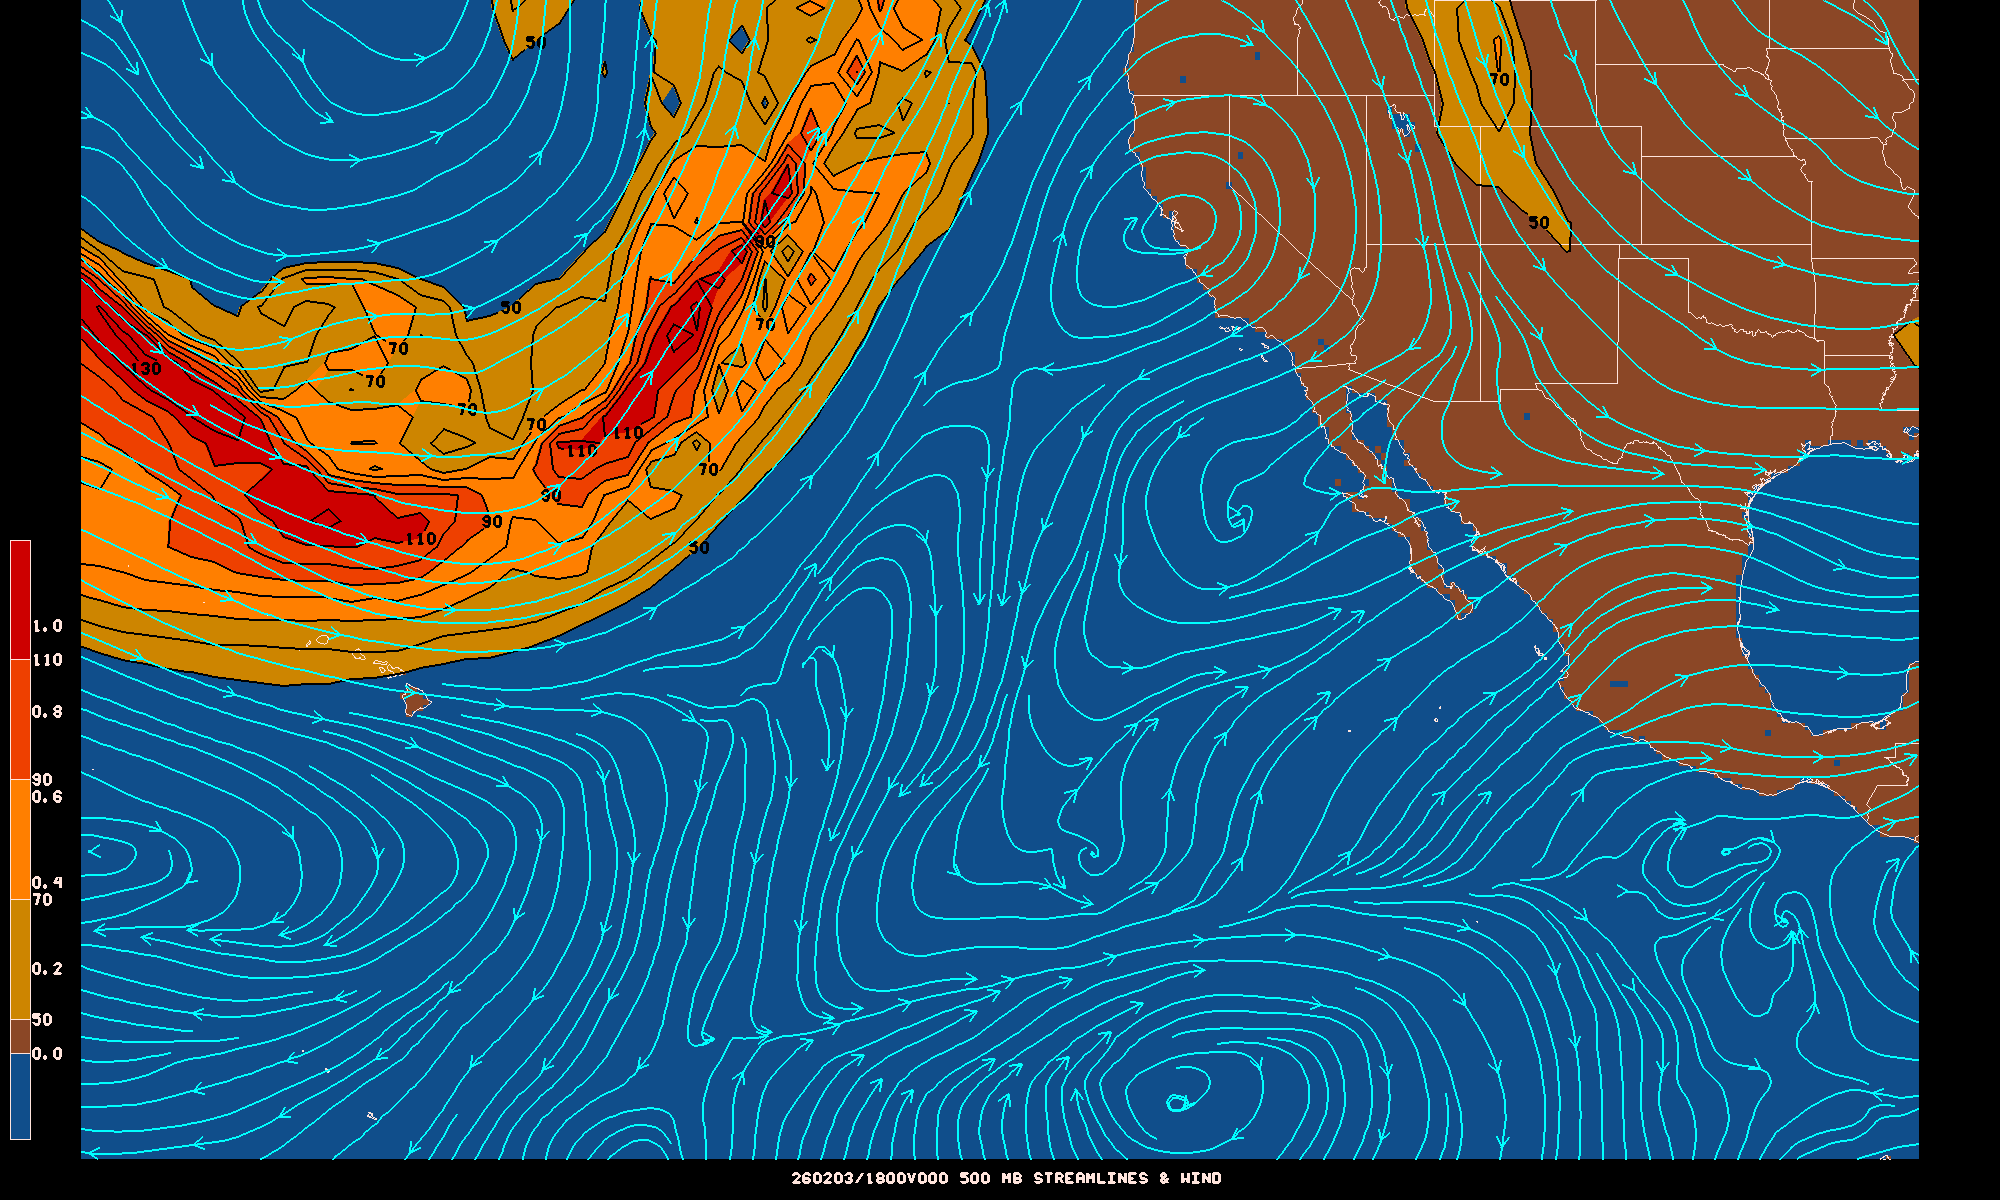
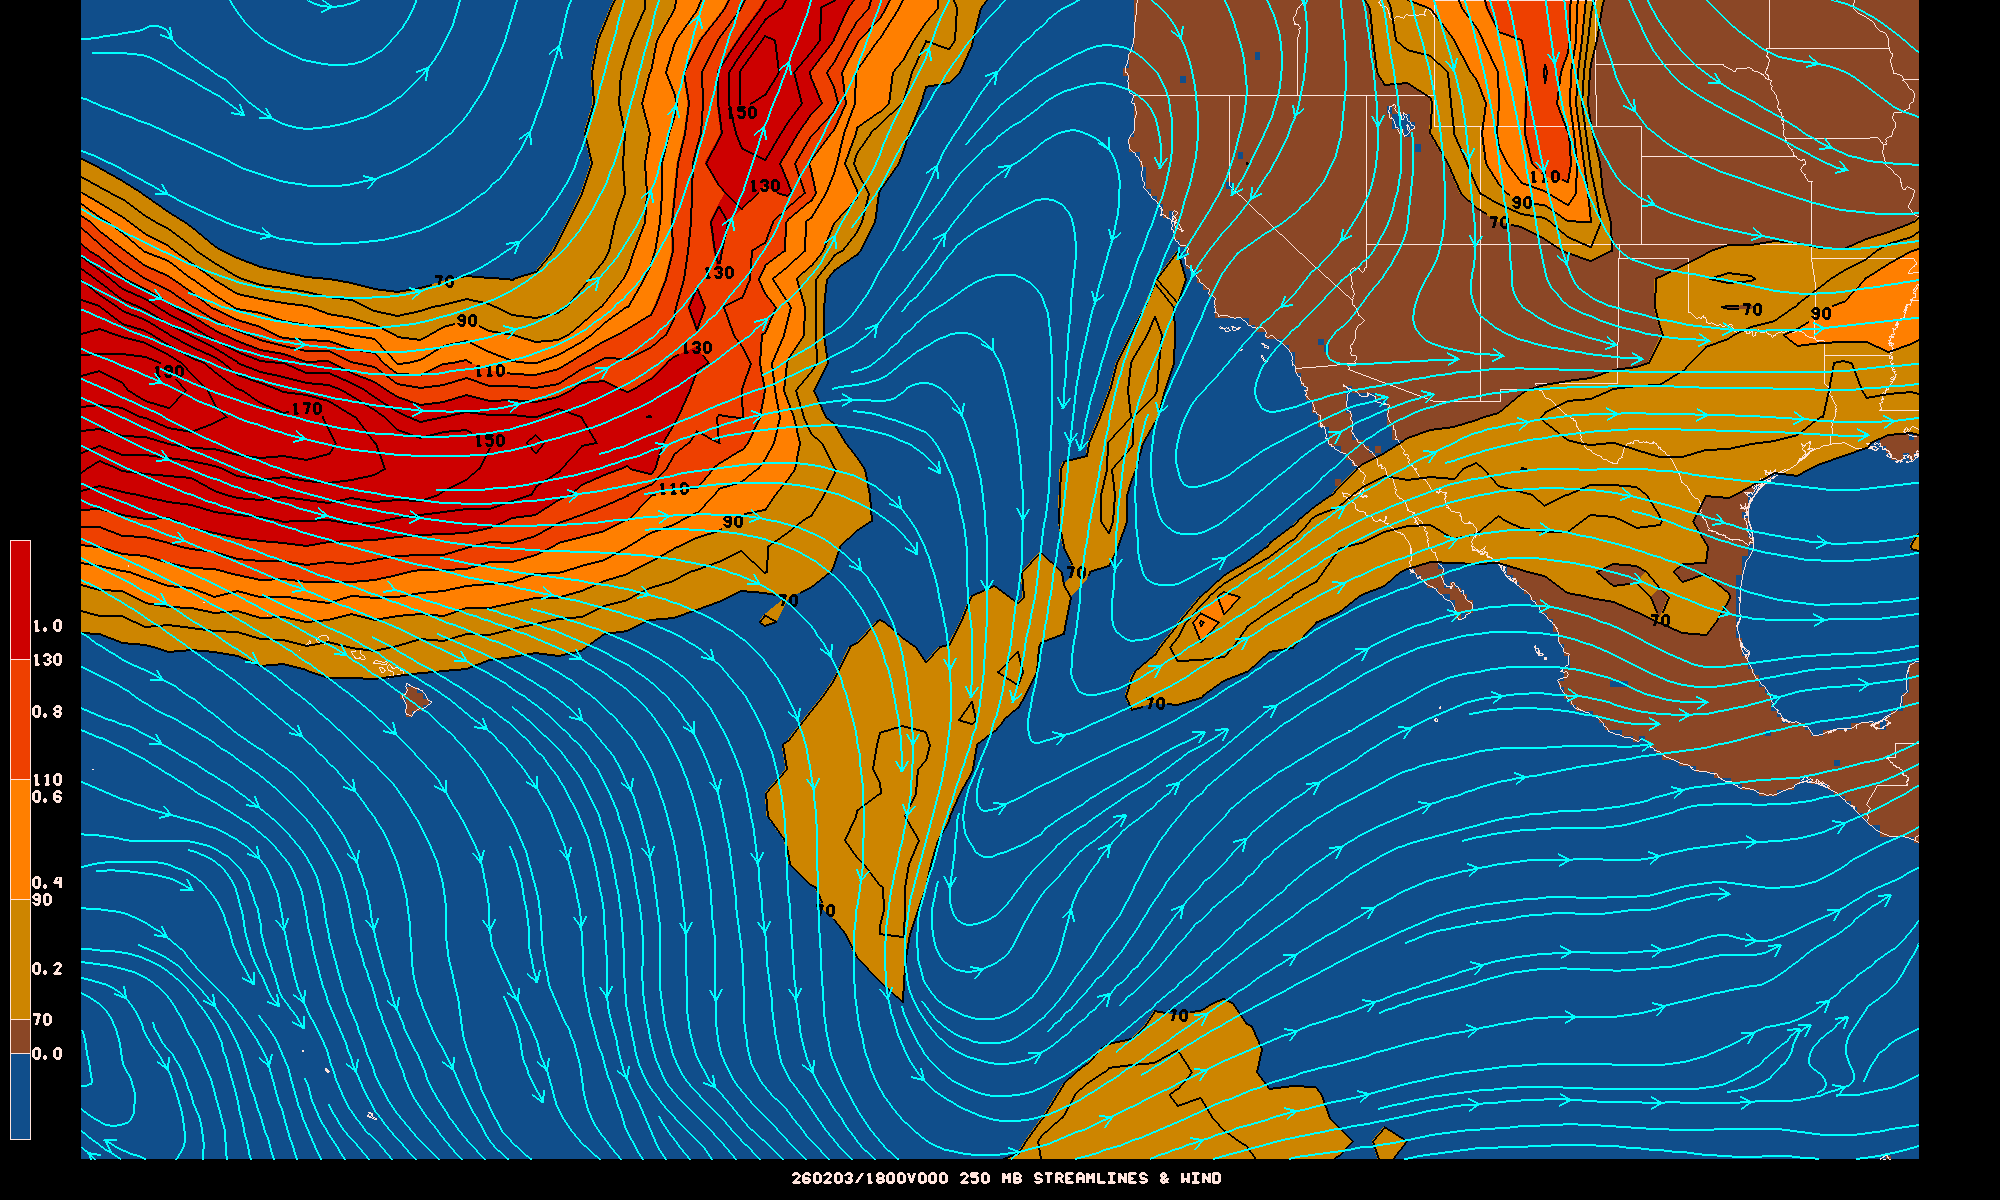
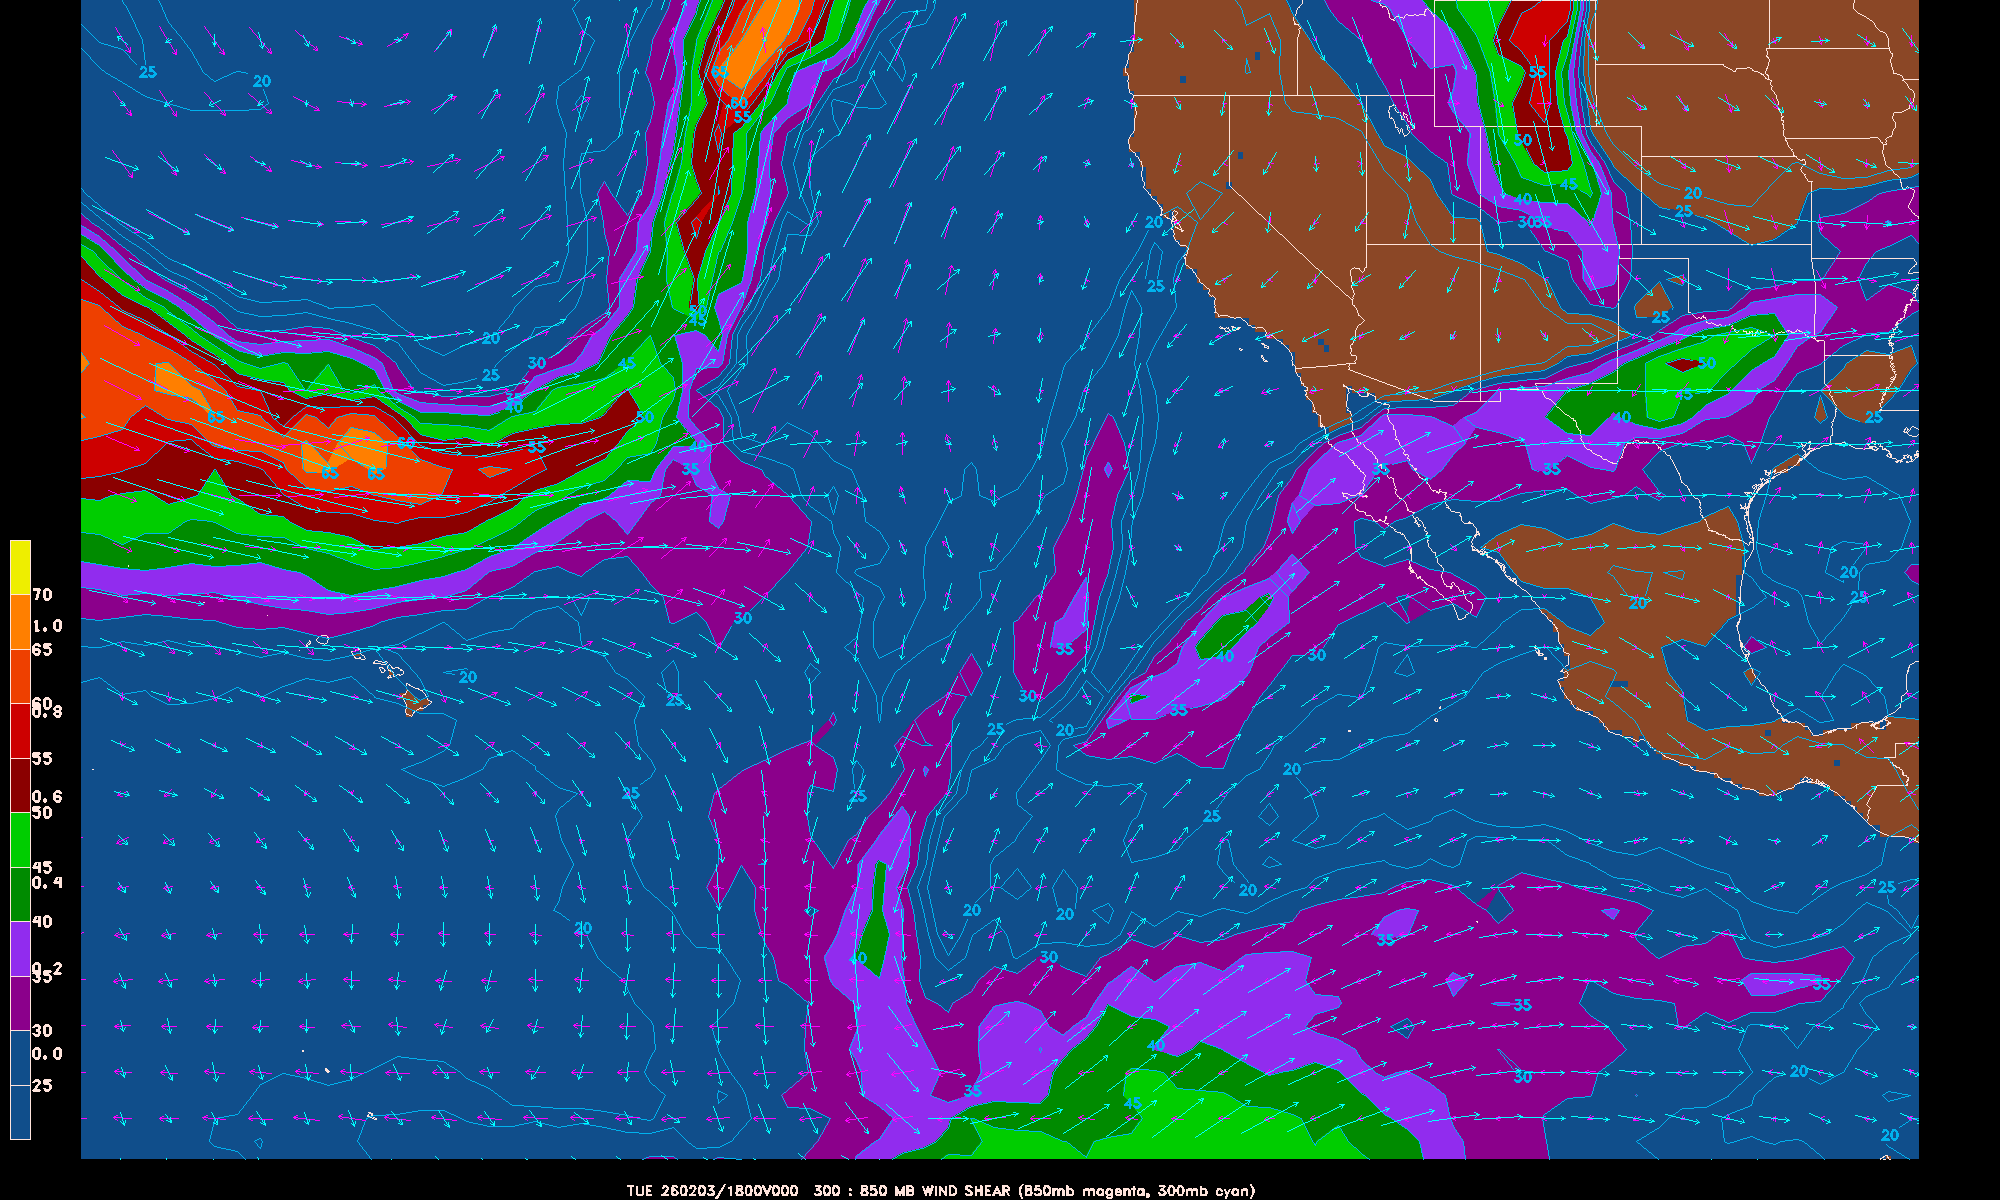
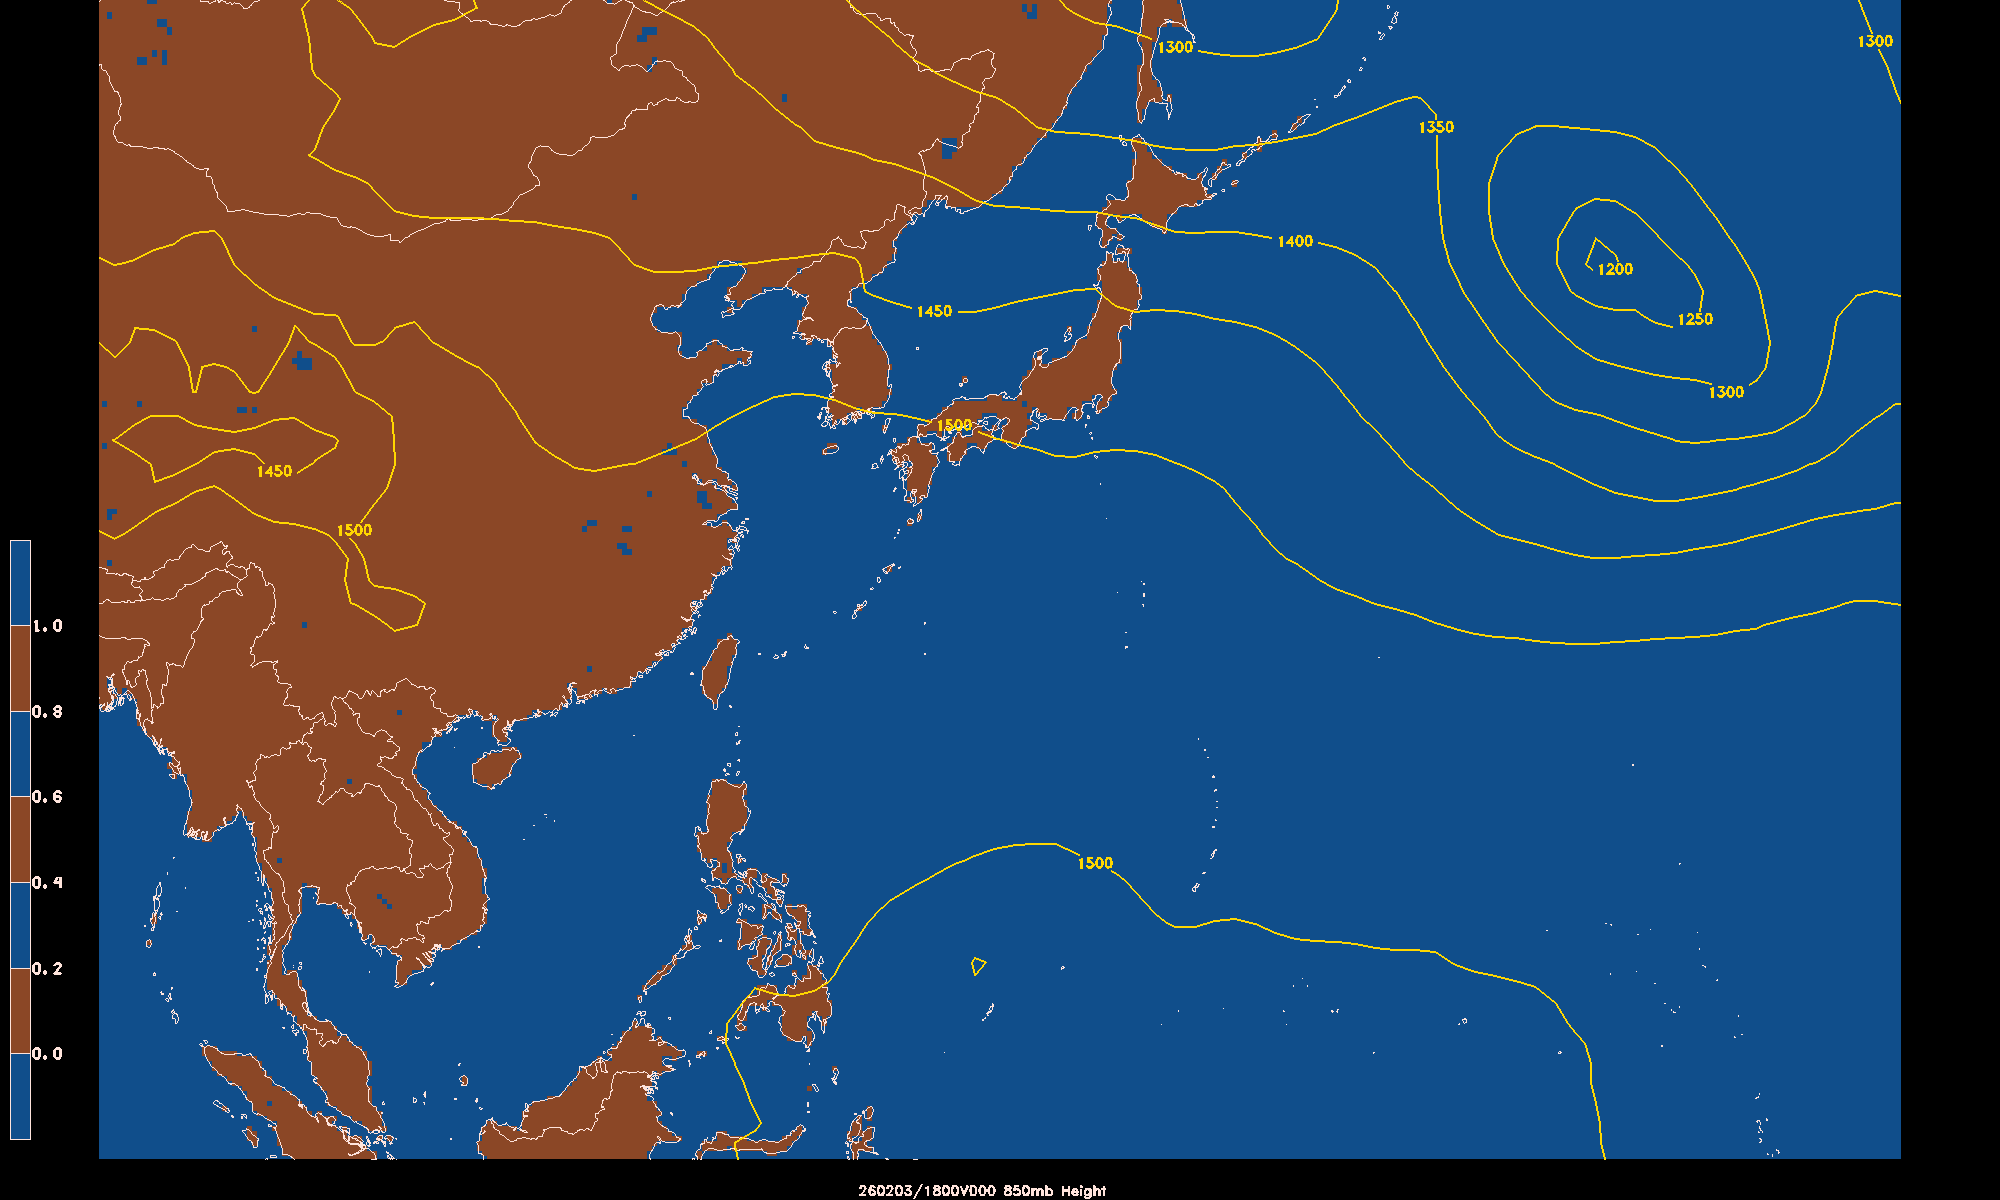
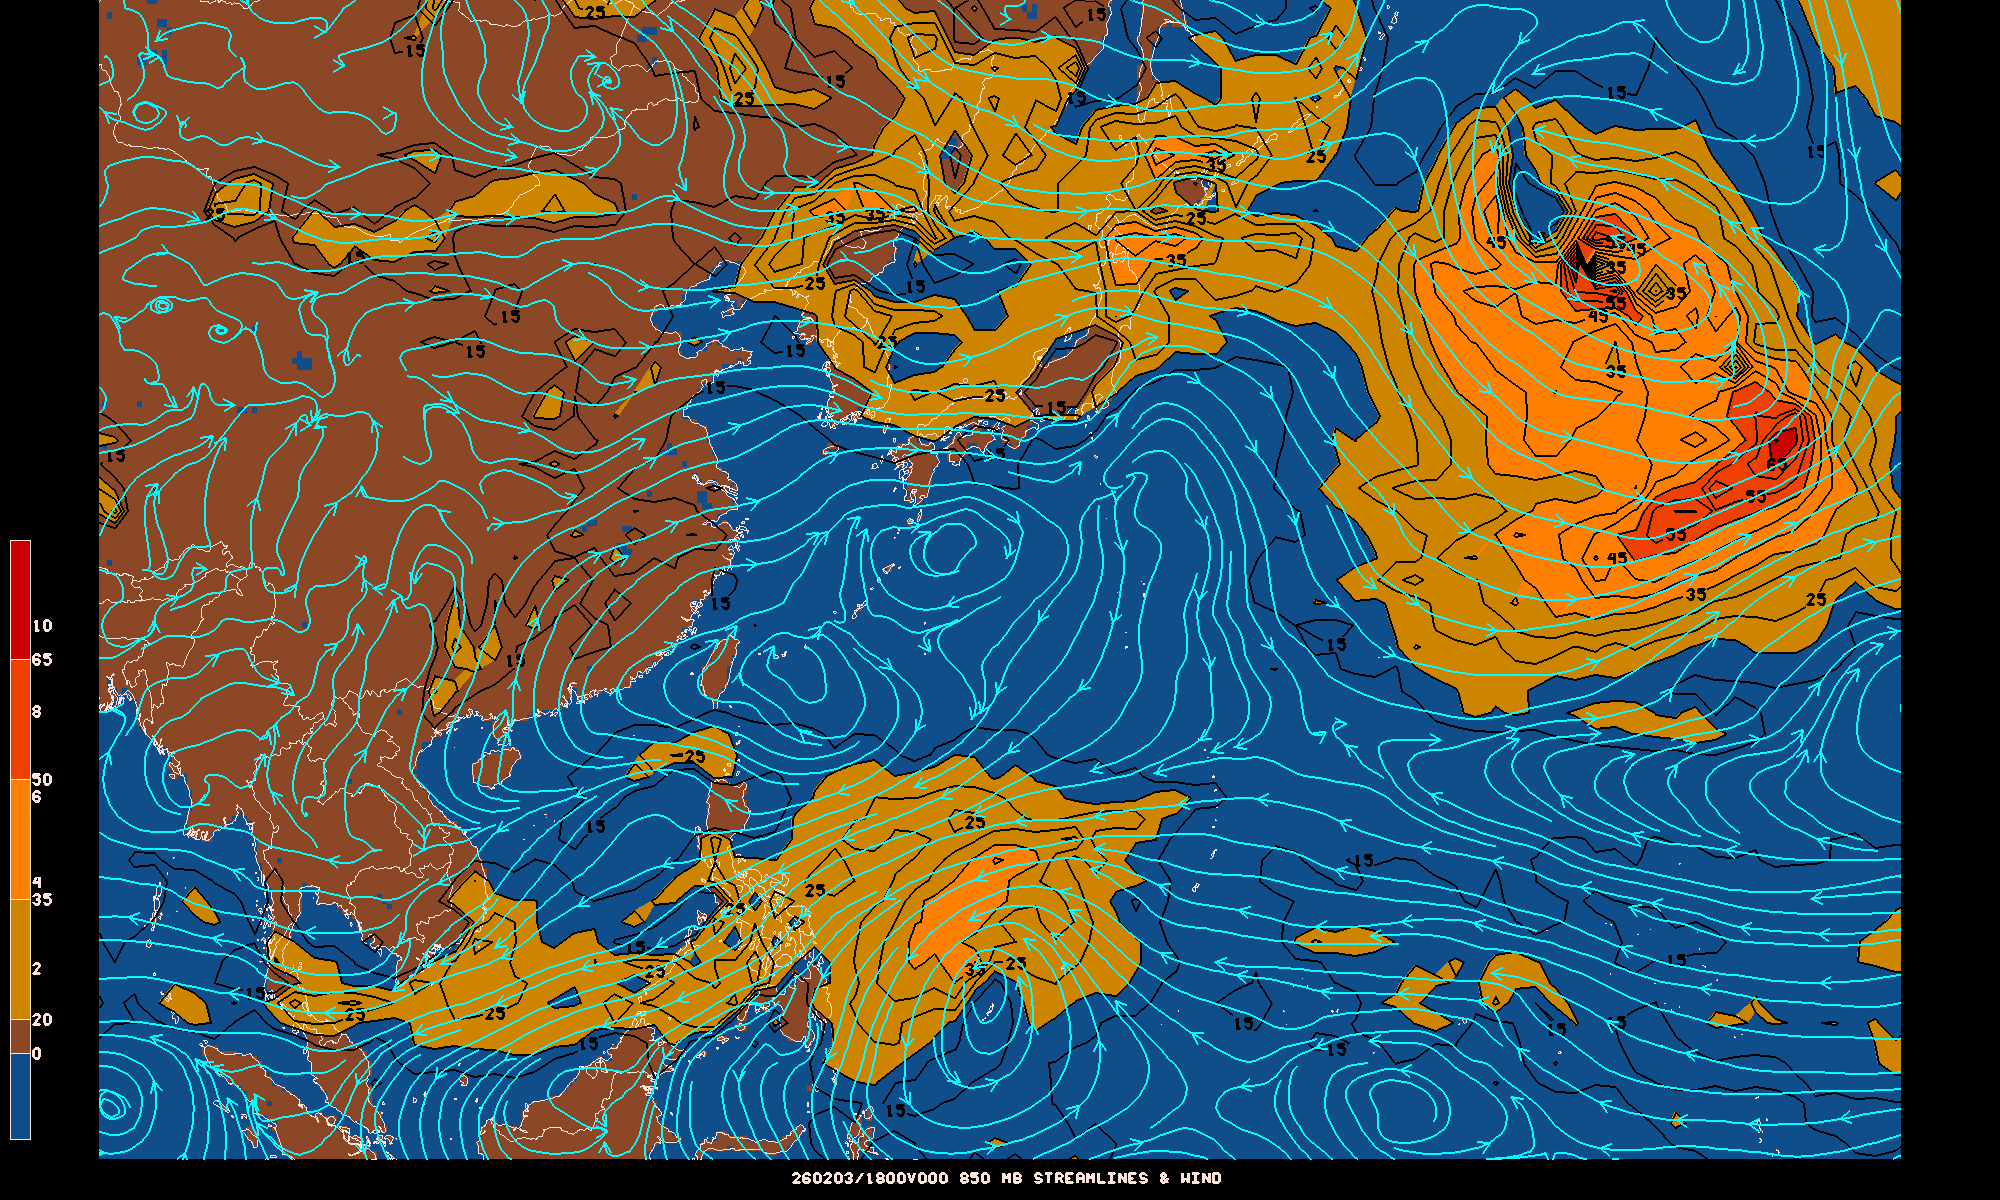
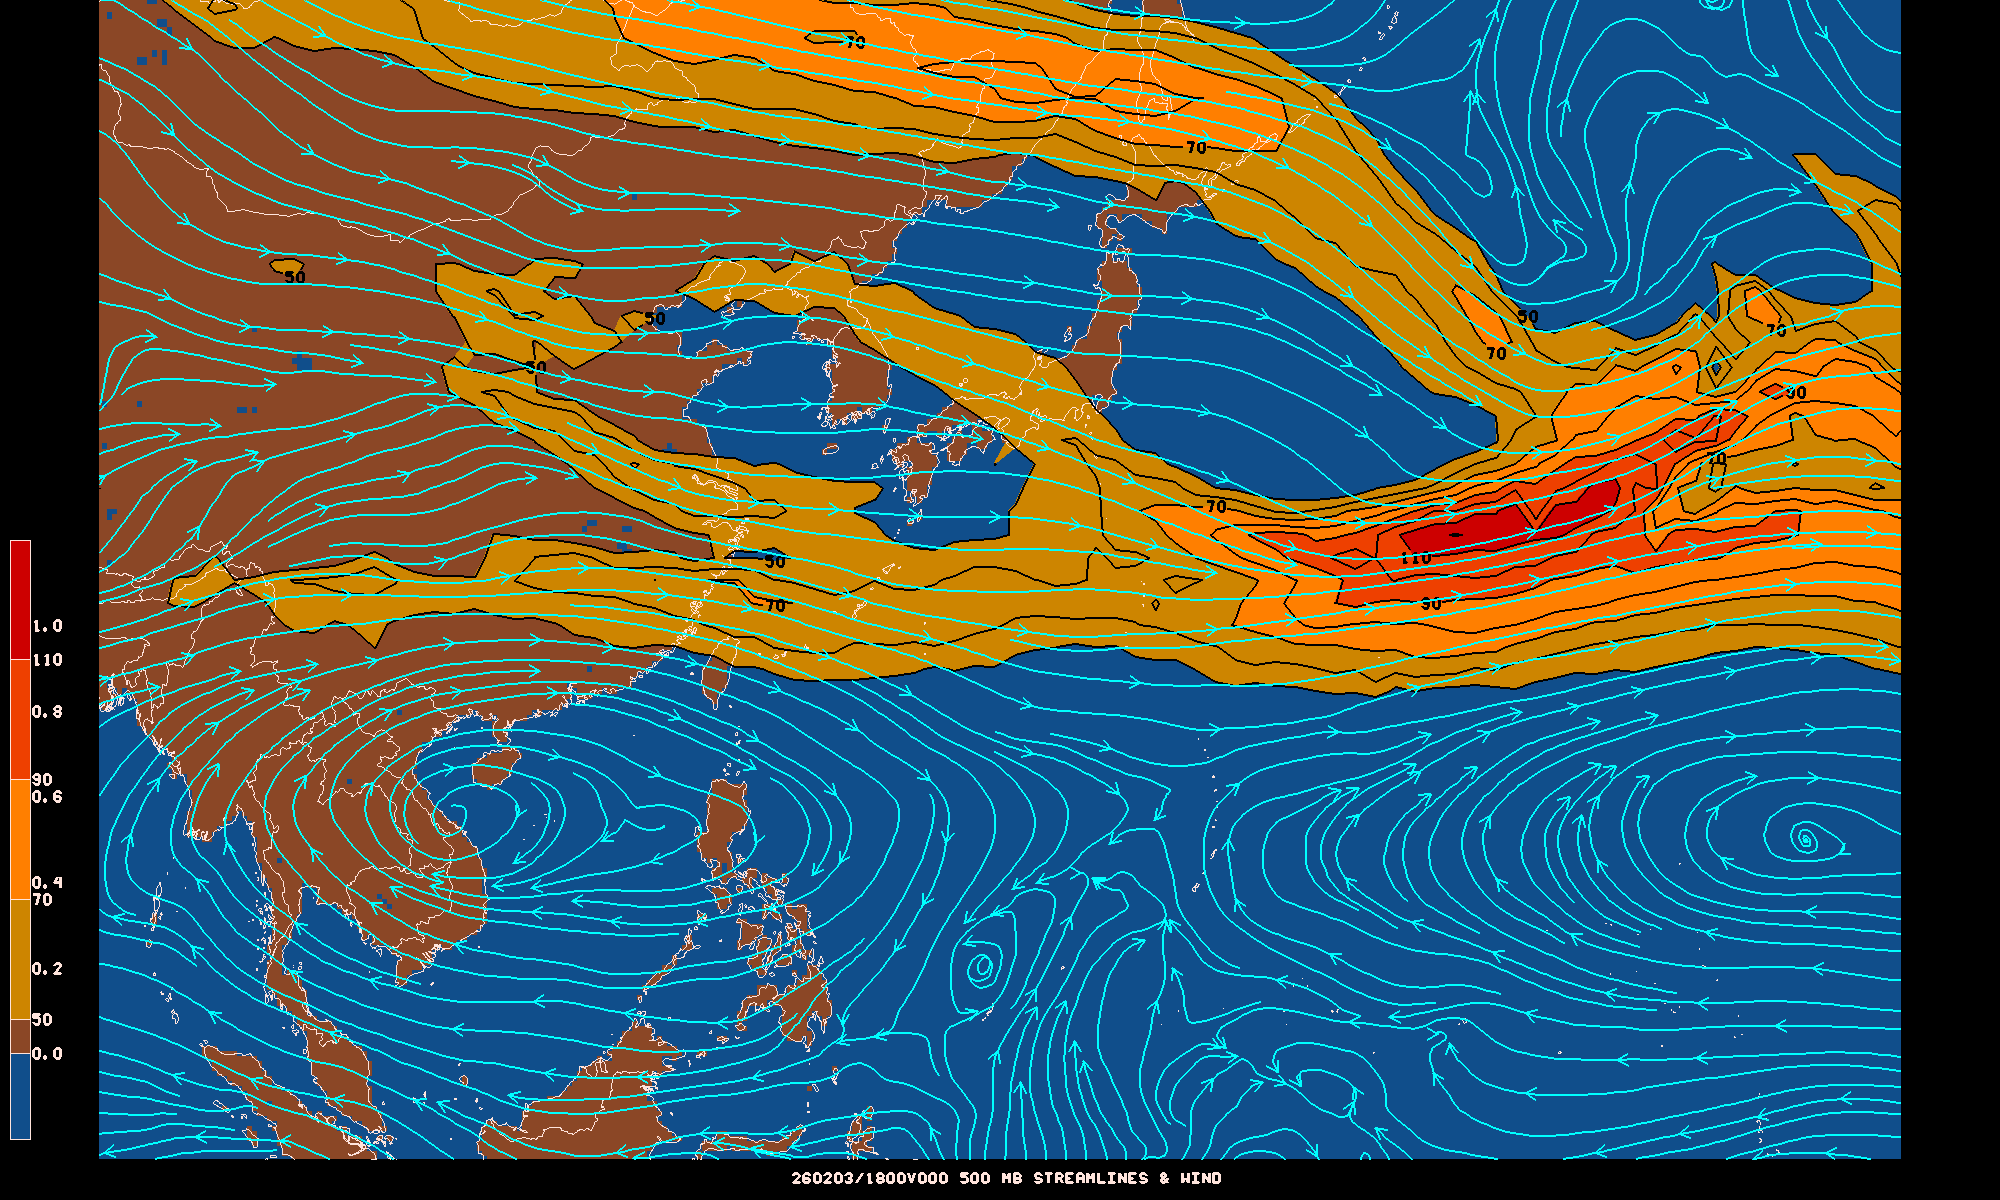
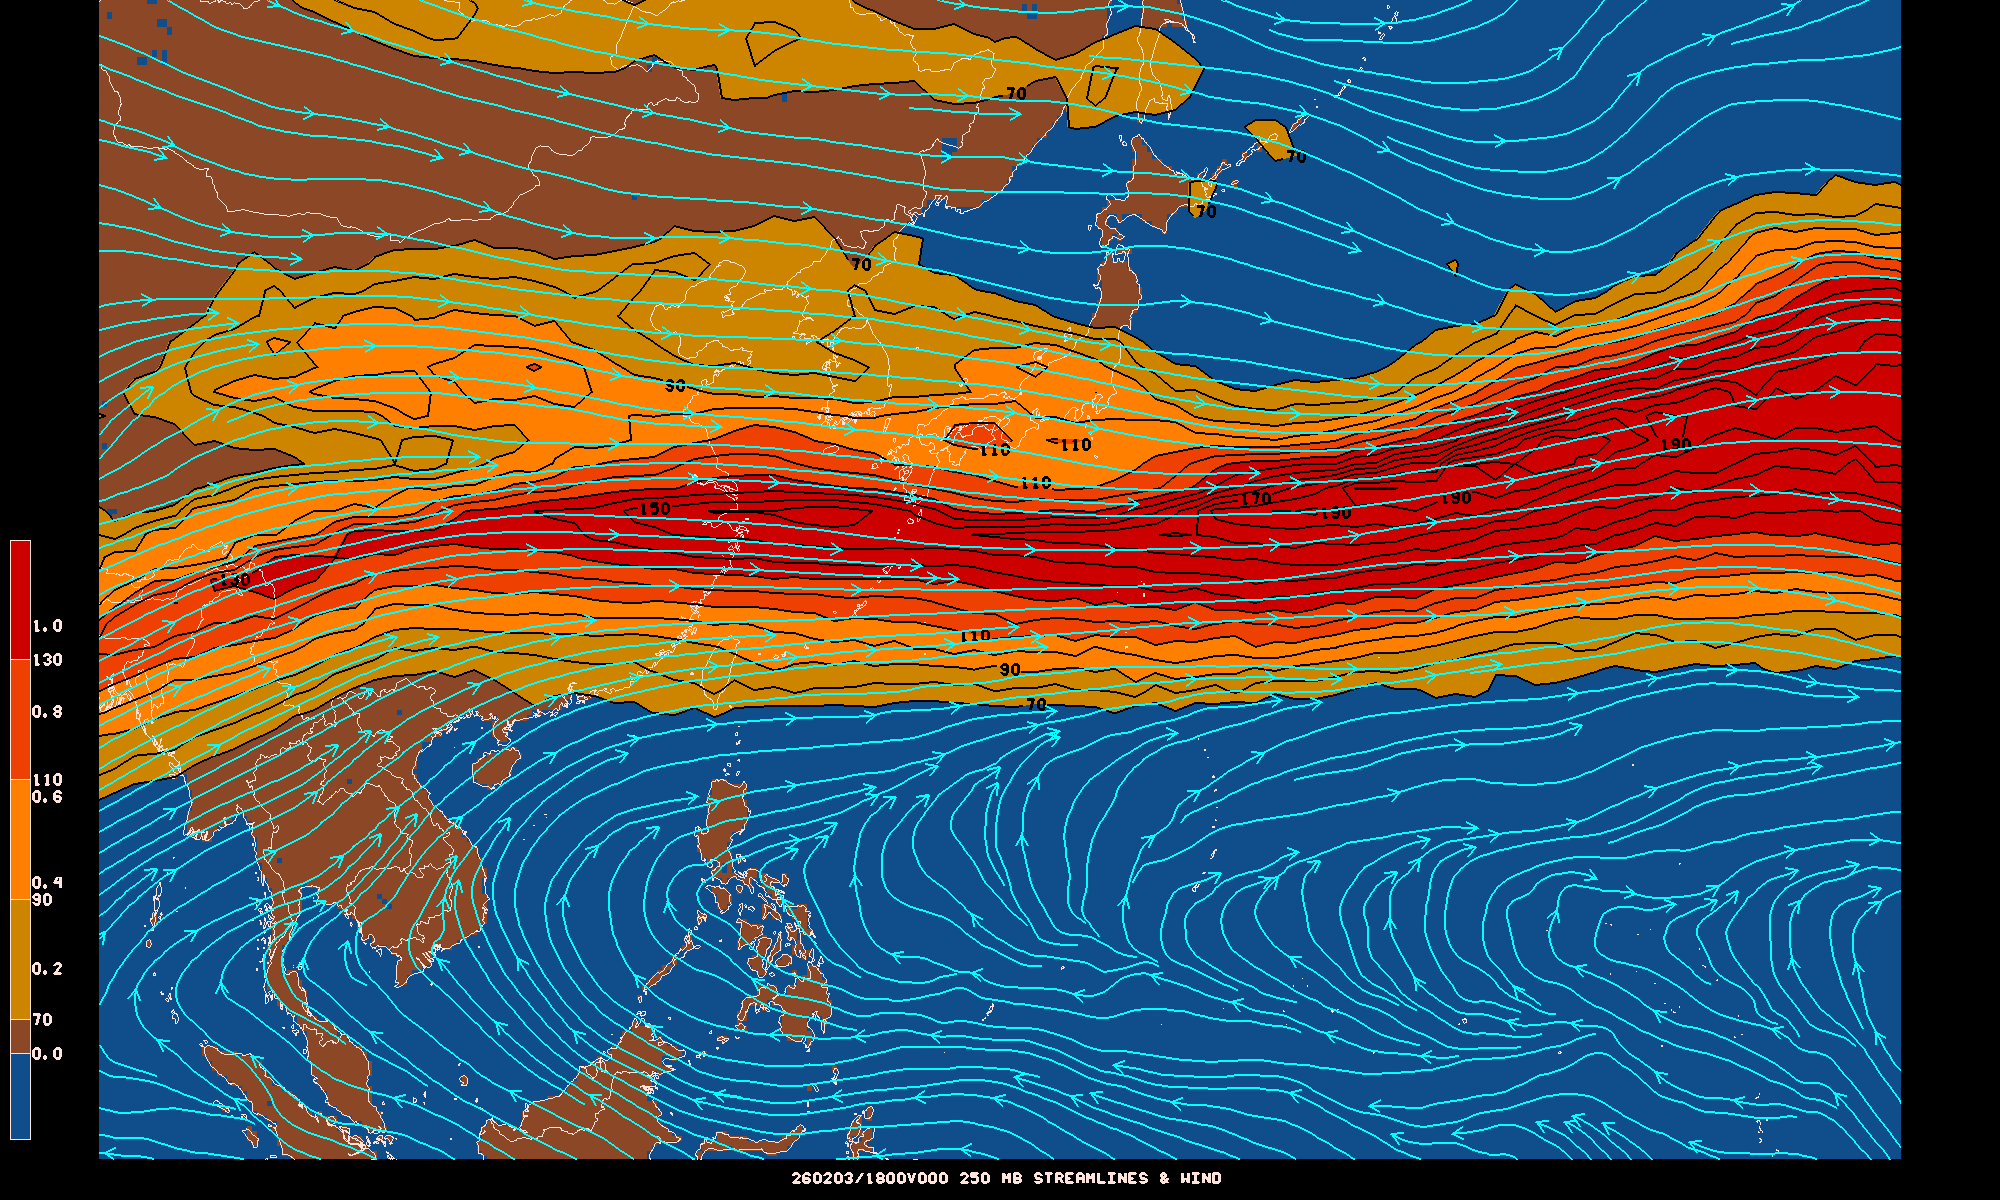
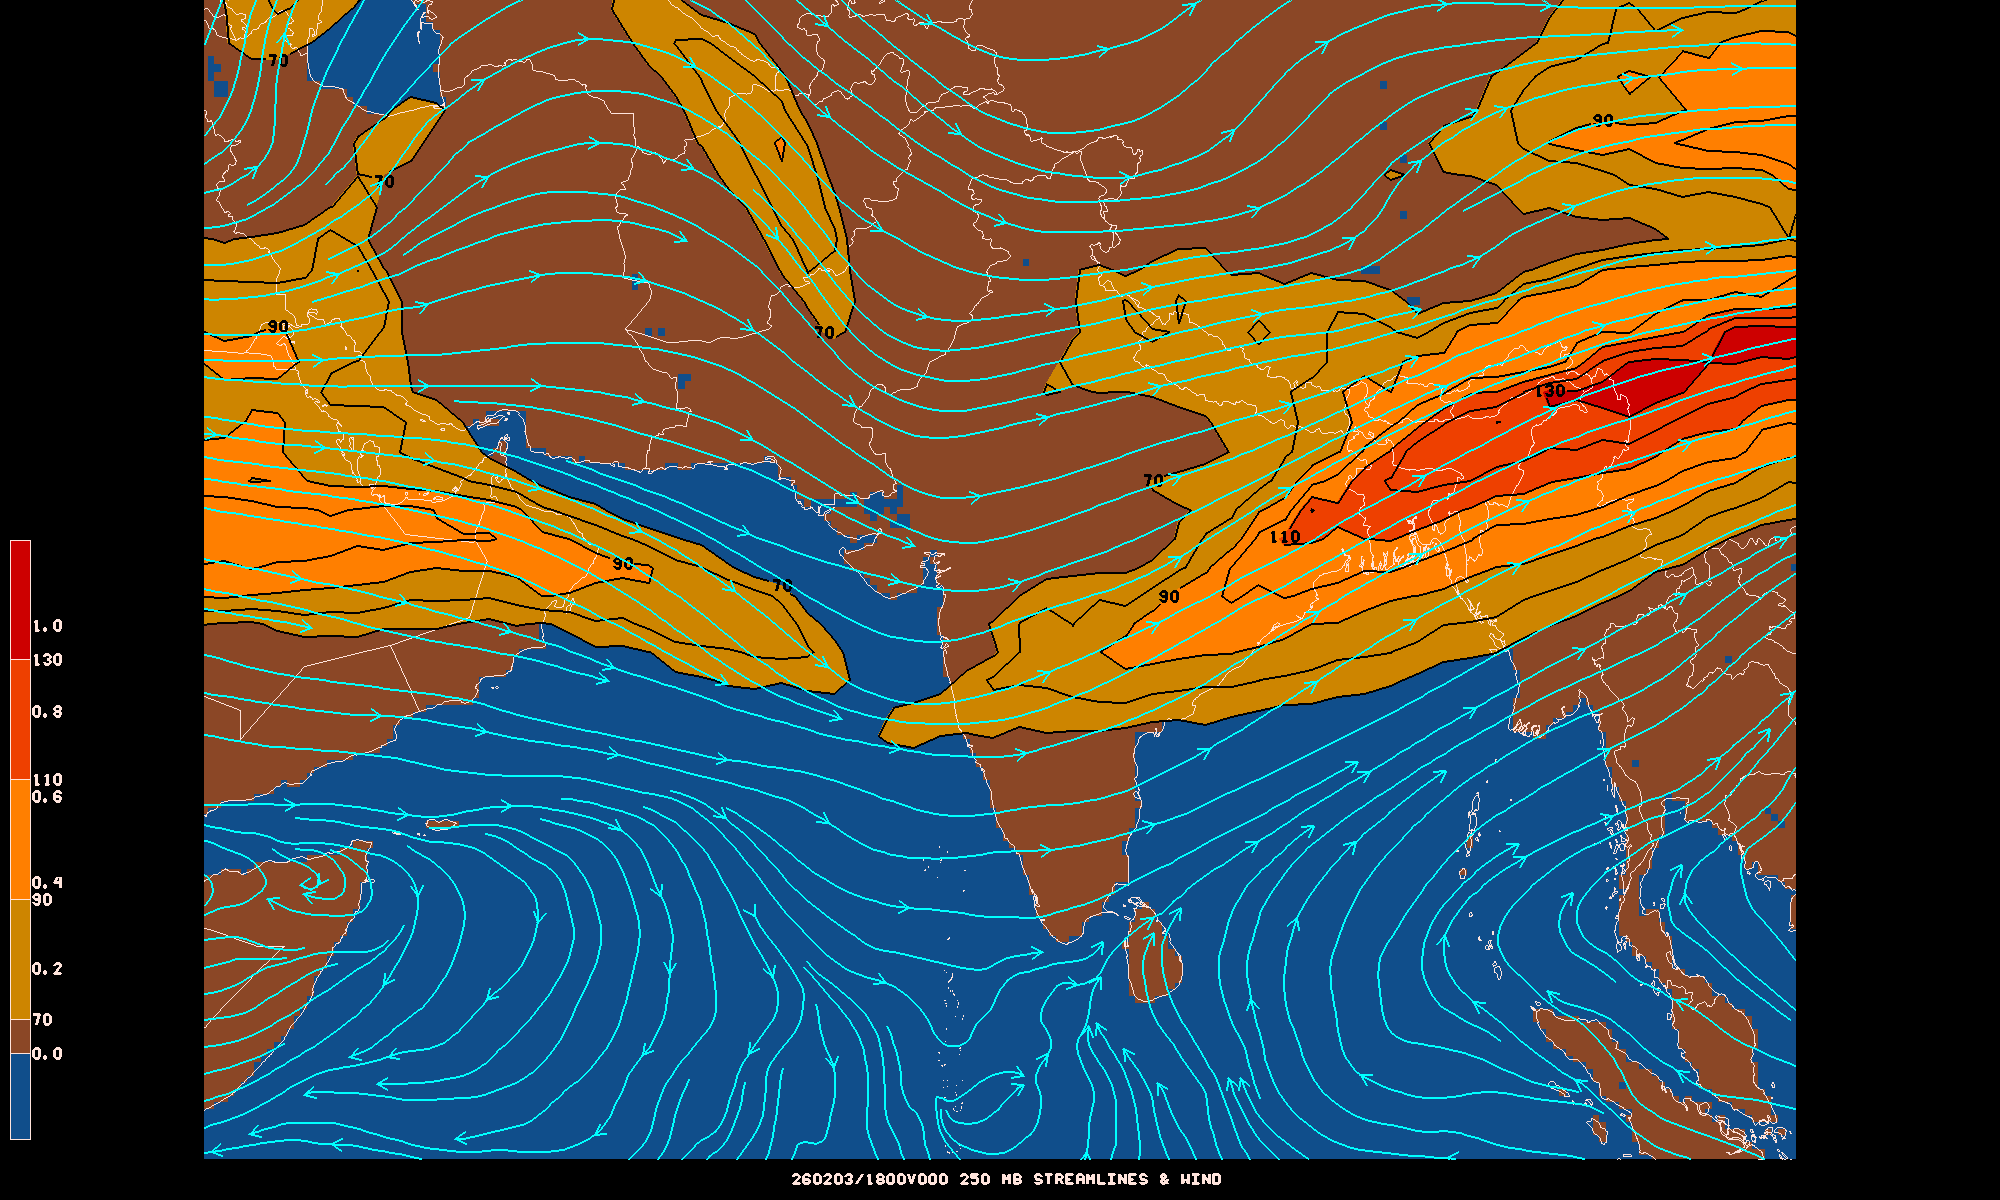
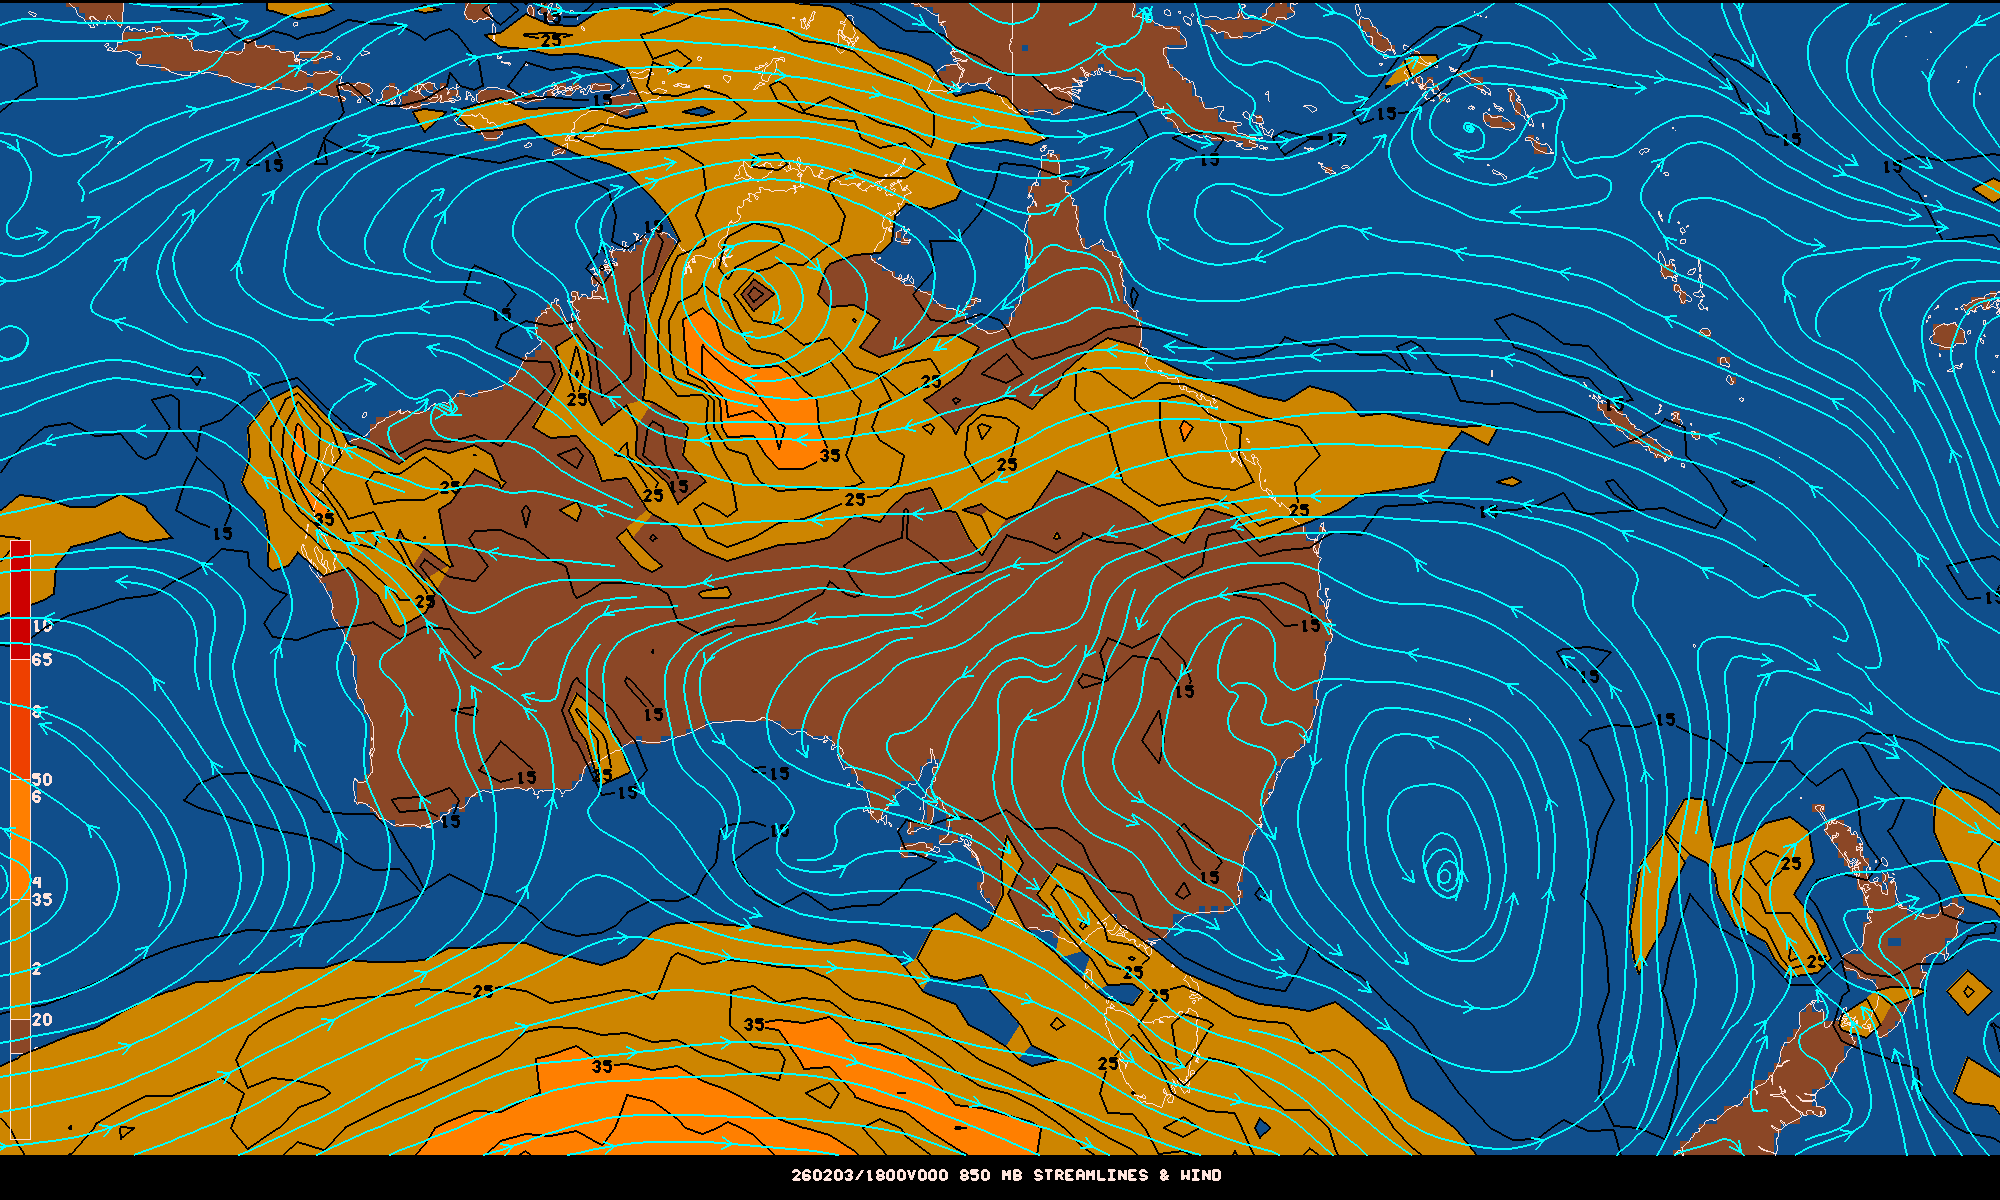
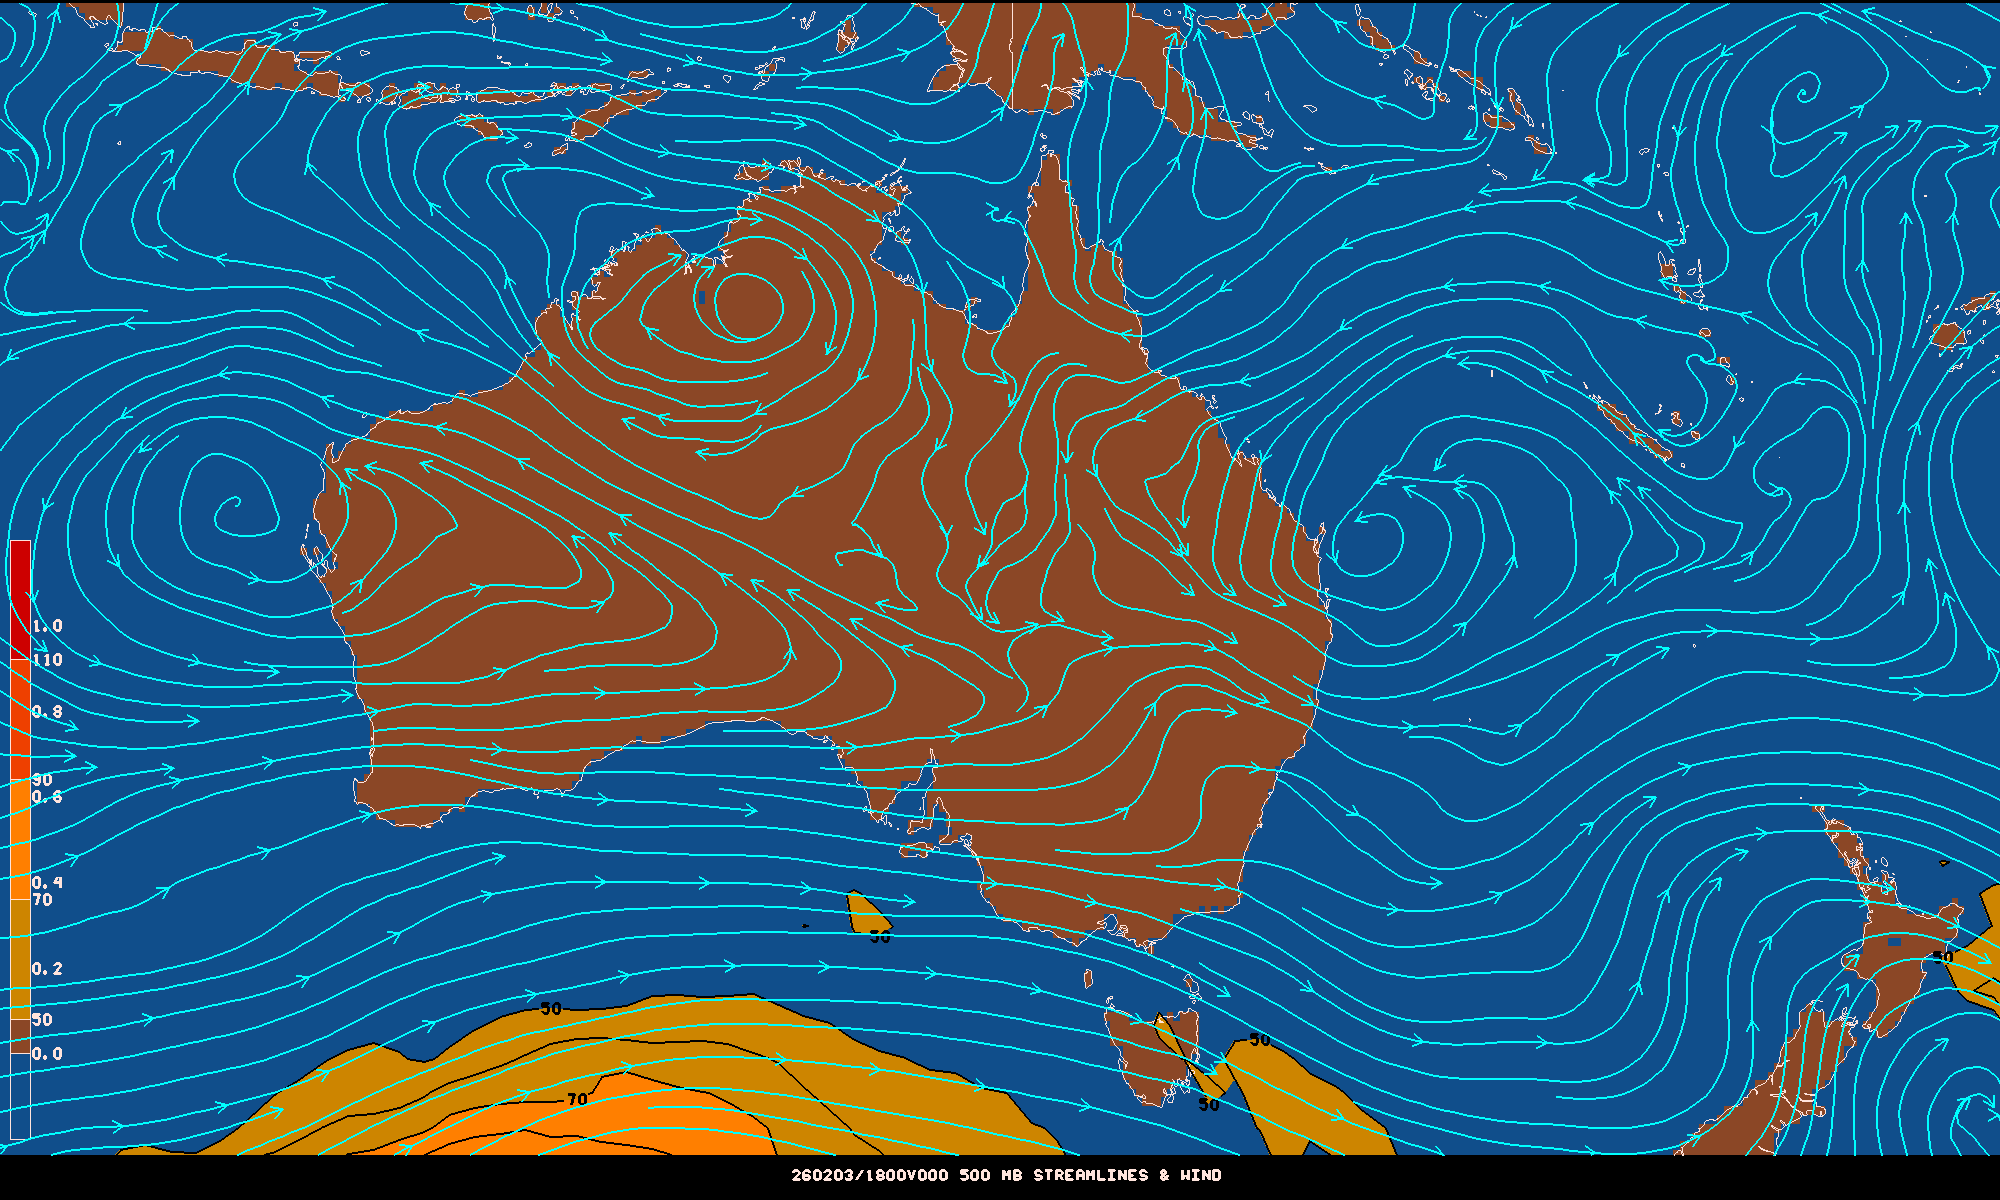
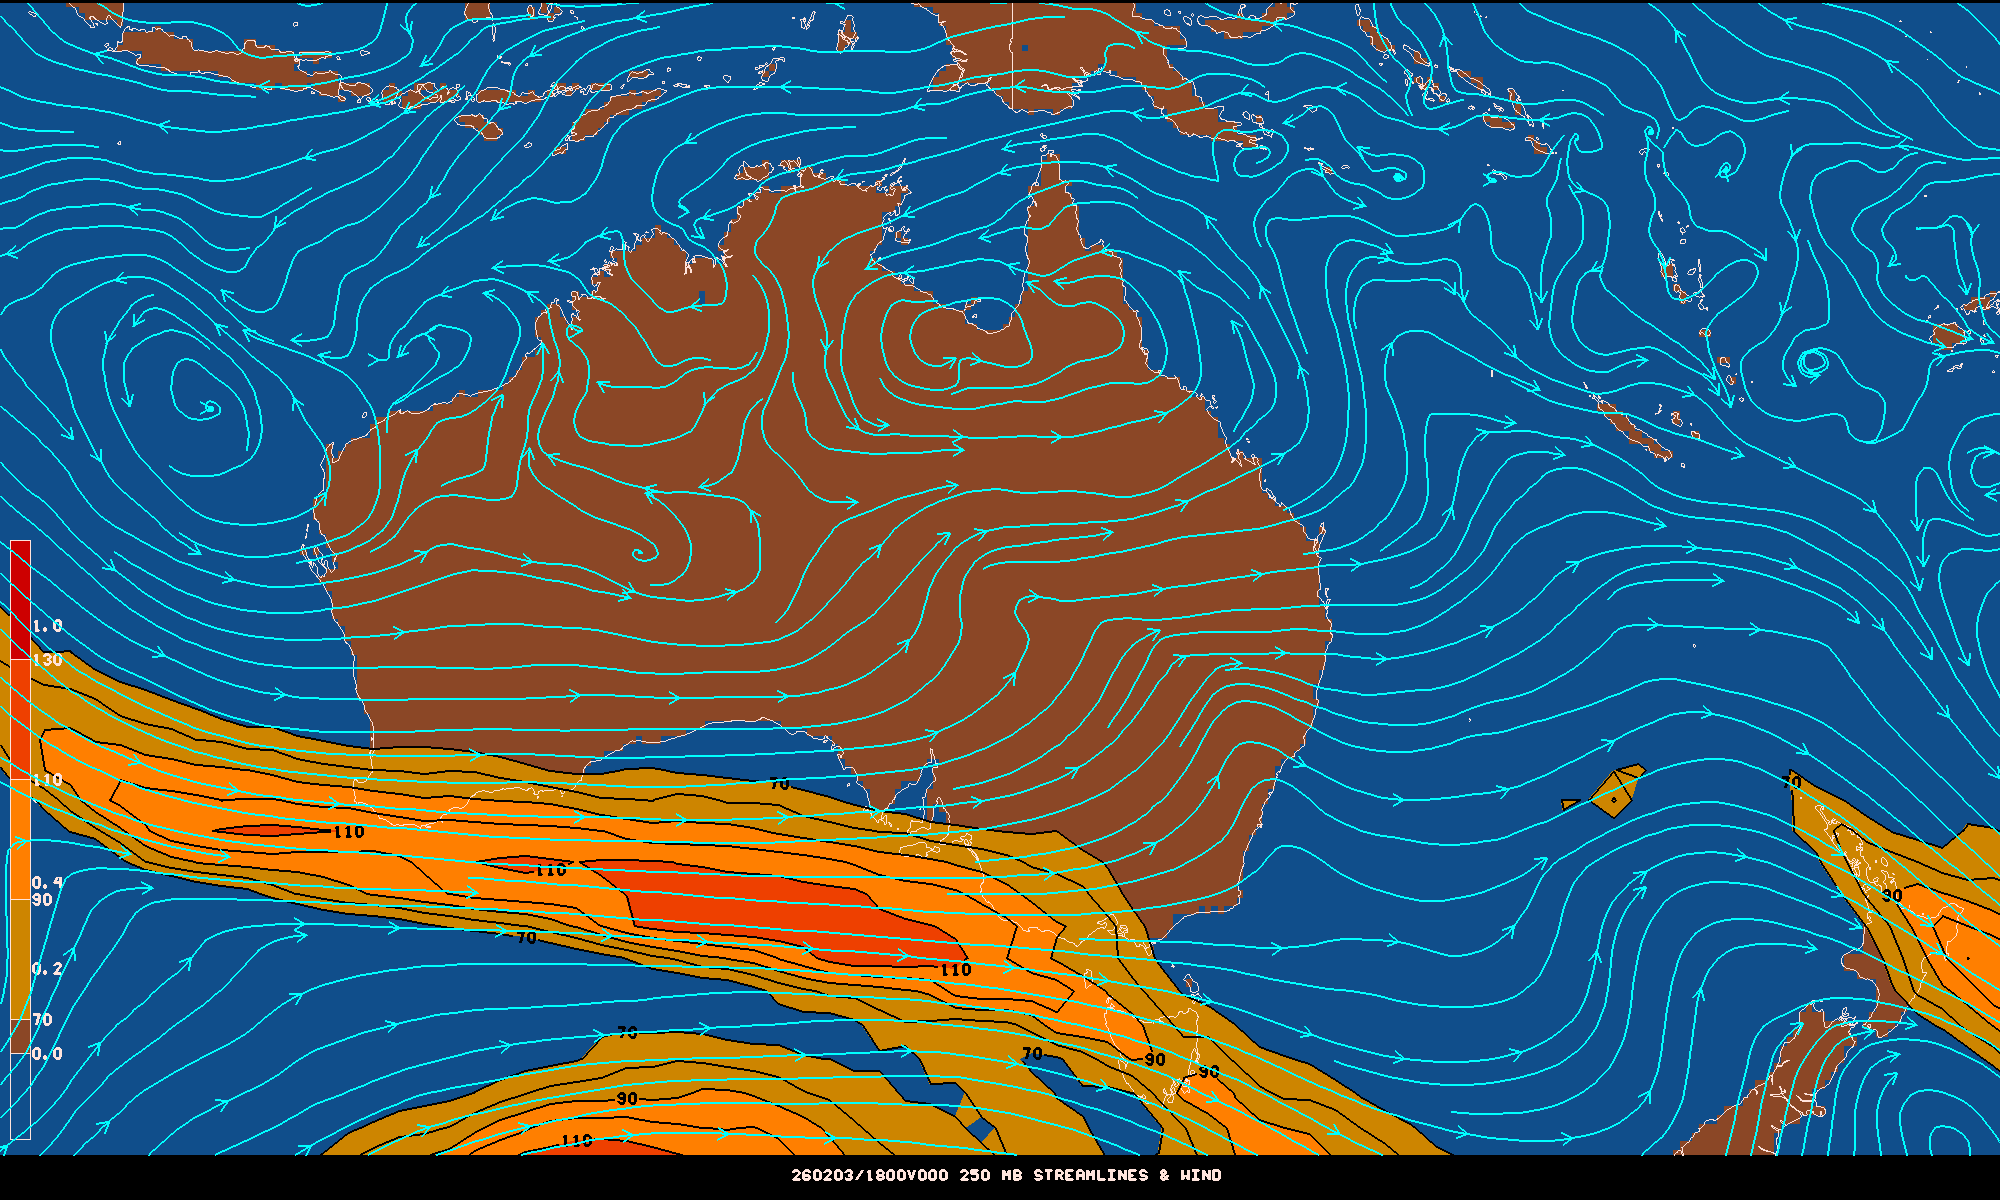
| Region | SST | 850mb HGT | 850mb | 500mb | 250 mb | Shear |
|---|---|---|---|---|---|---|
| Atlantic Hurricane | 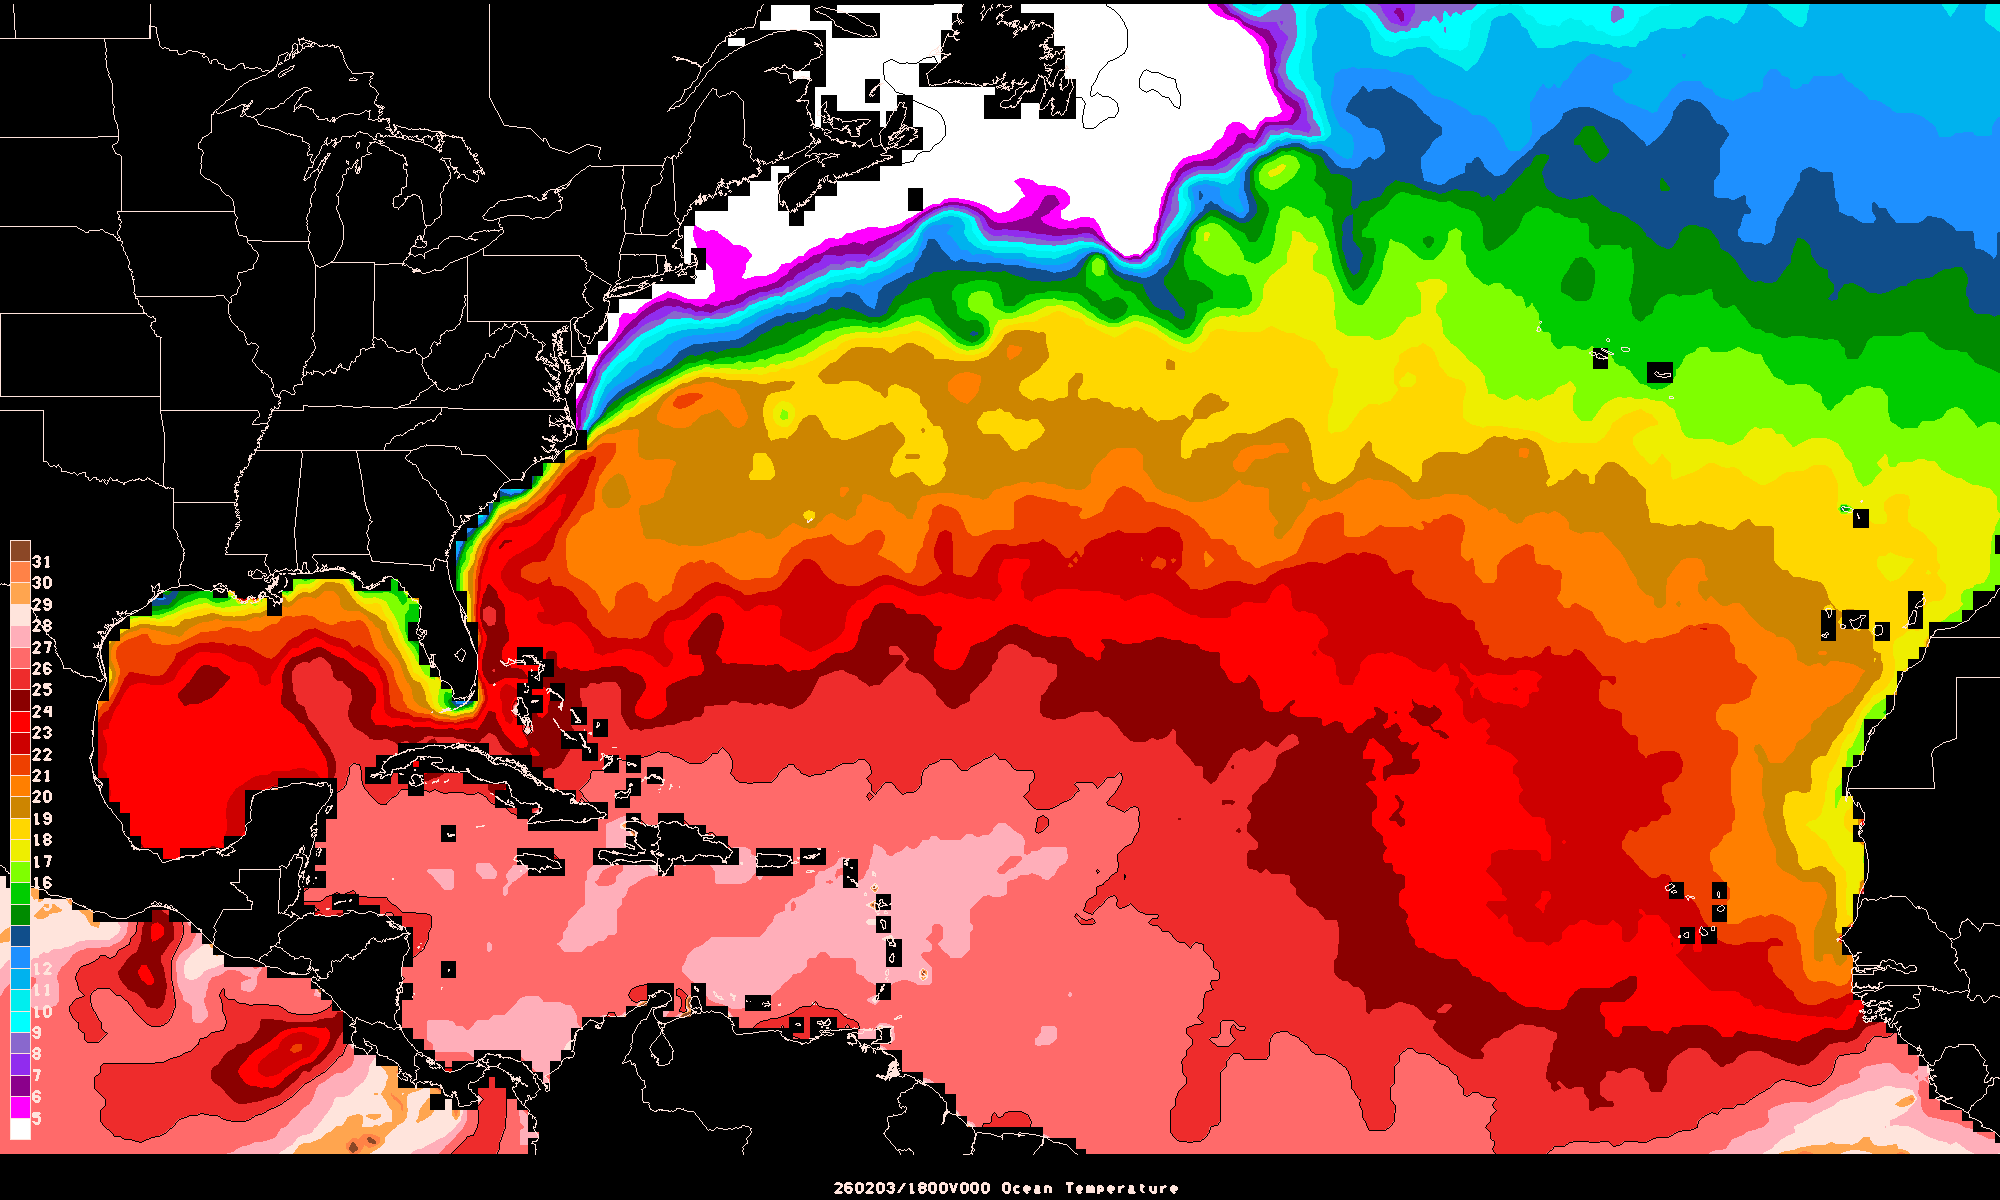 |
 |
 |
 |
 |
 |
| East Pacific Hurcn | 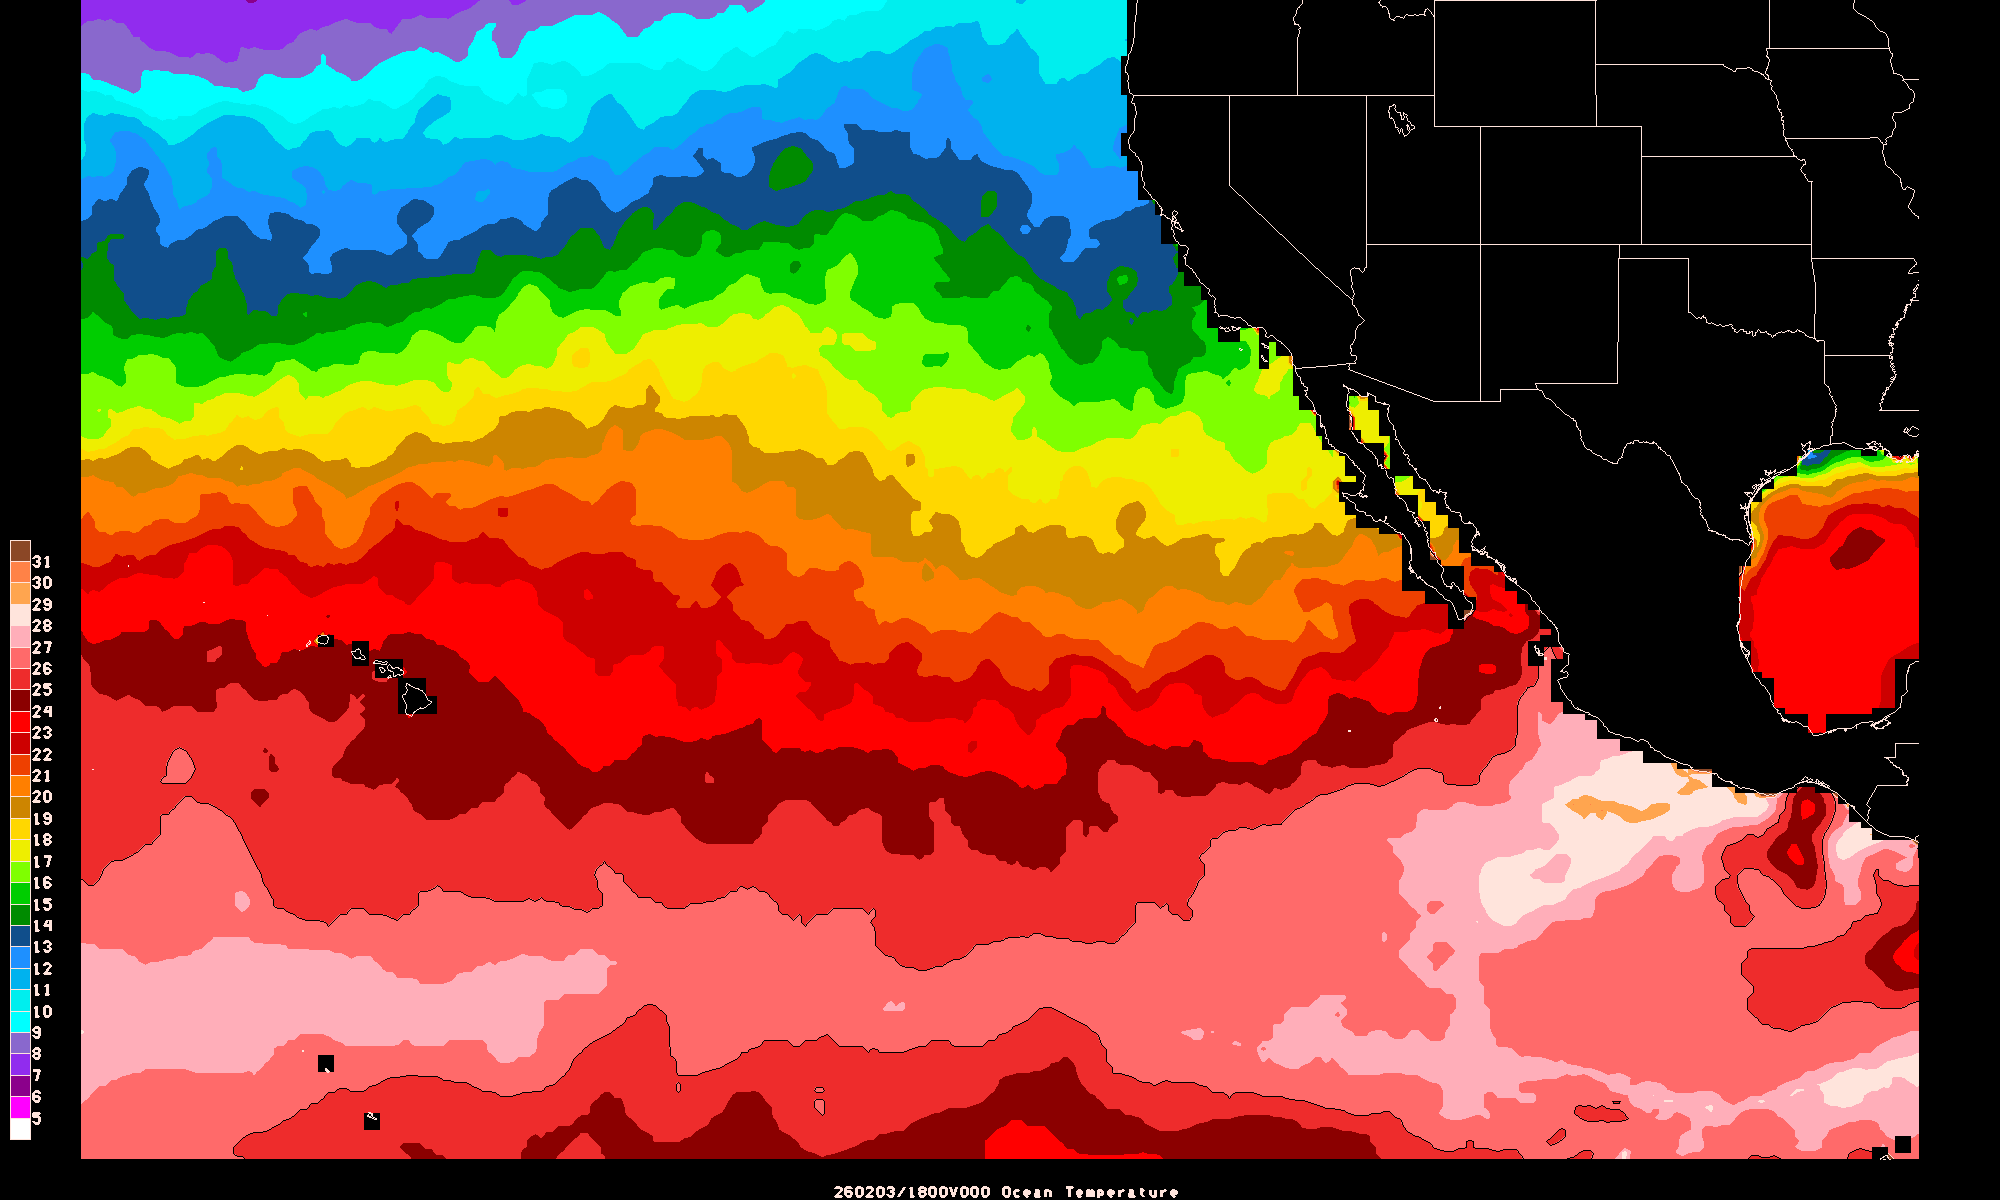 |
 |
 |
 |
 |
 |
| West Pacific Hurcn | 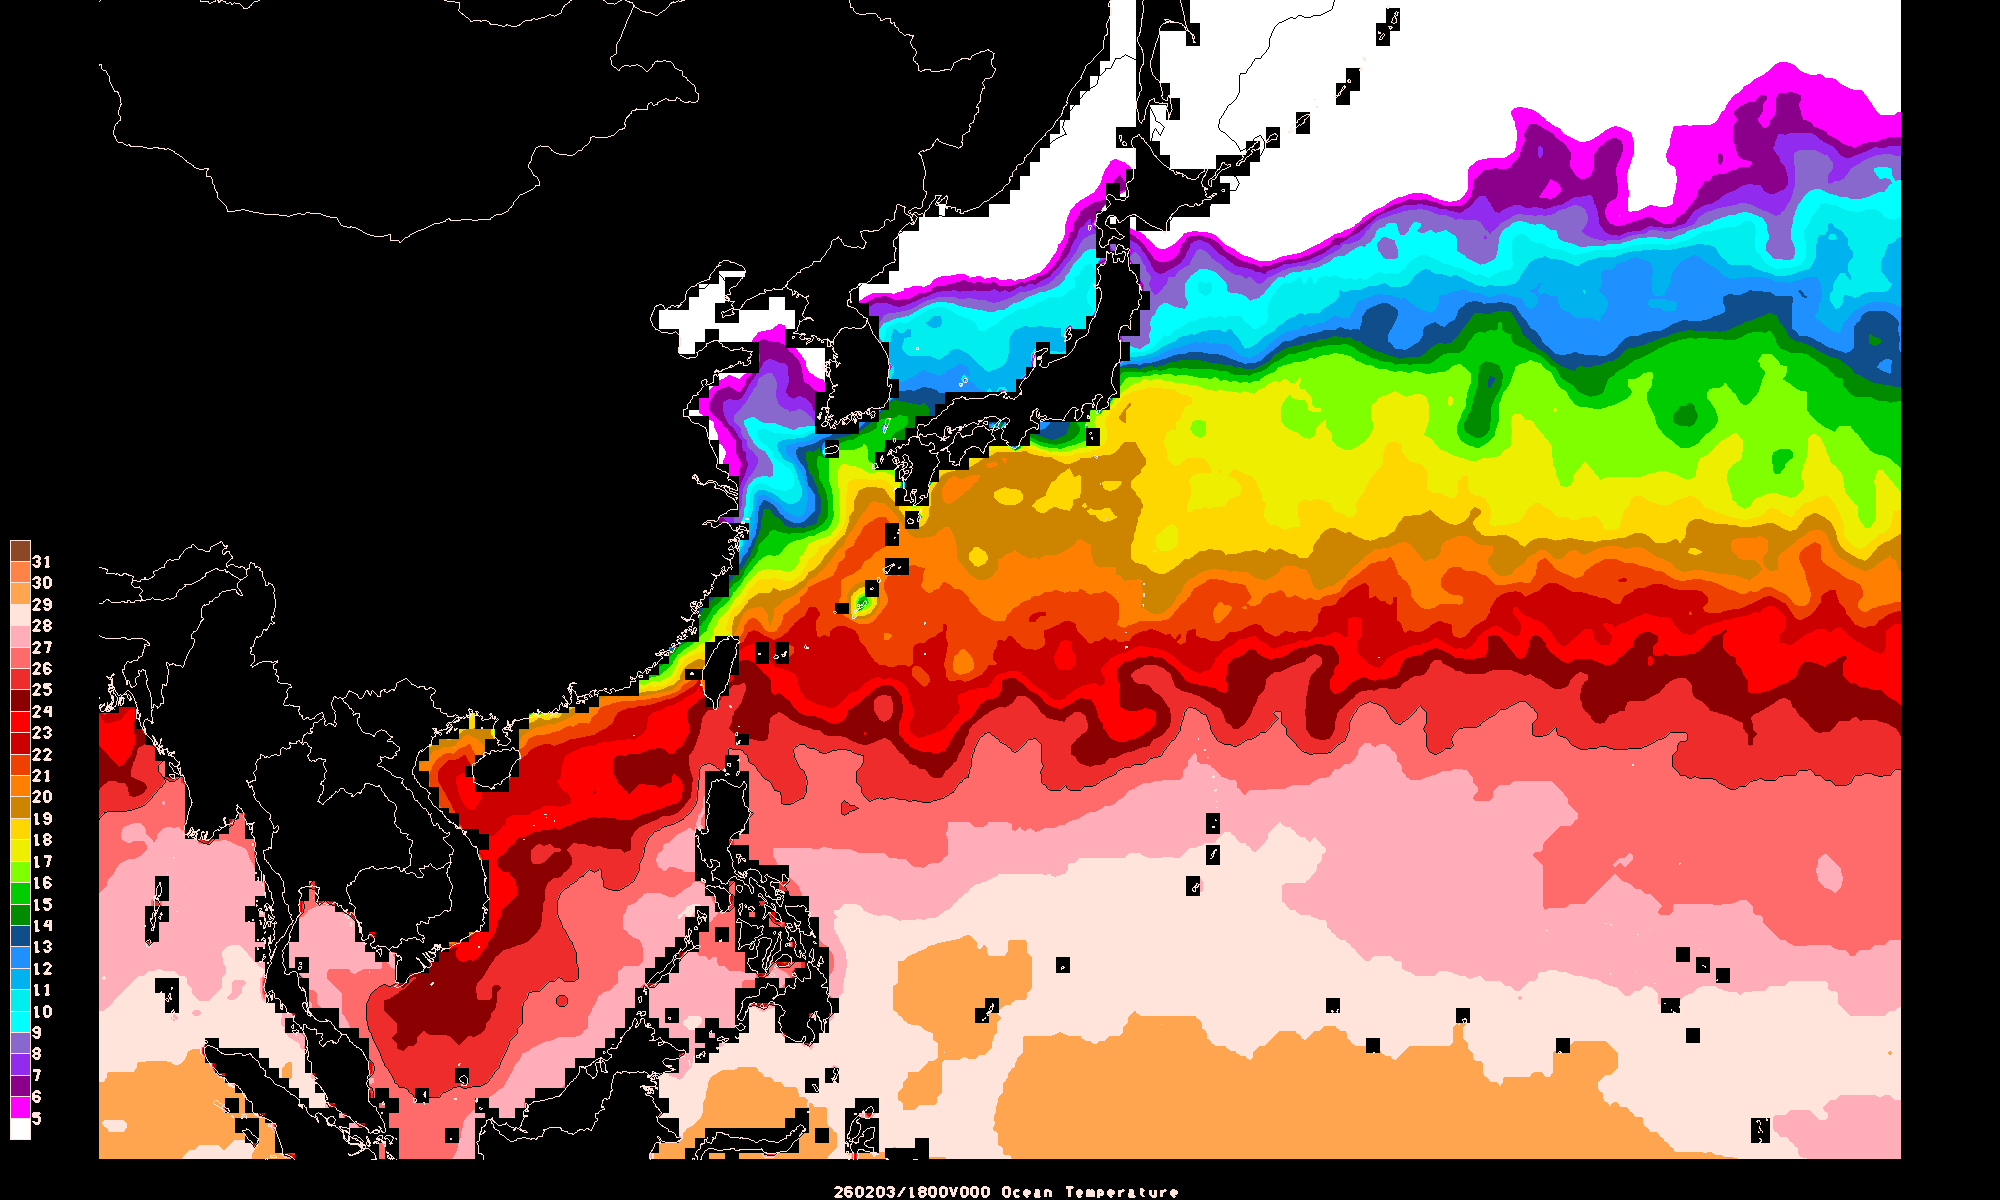 |
 |
 |
 |
 |
 |
| N Indian Ocn Hurcn | 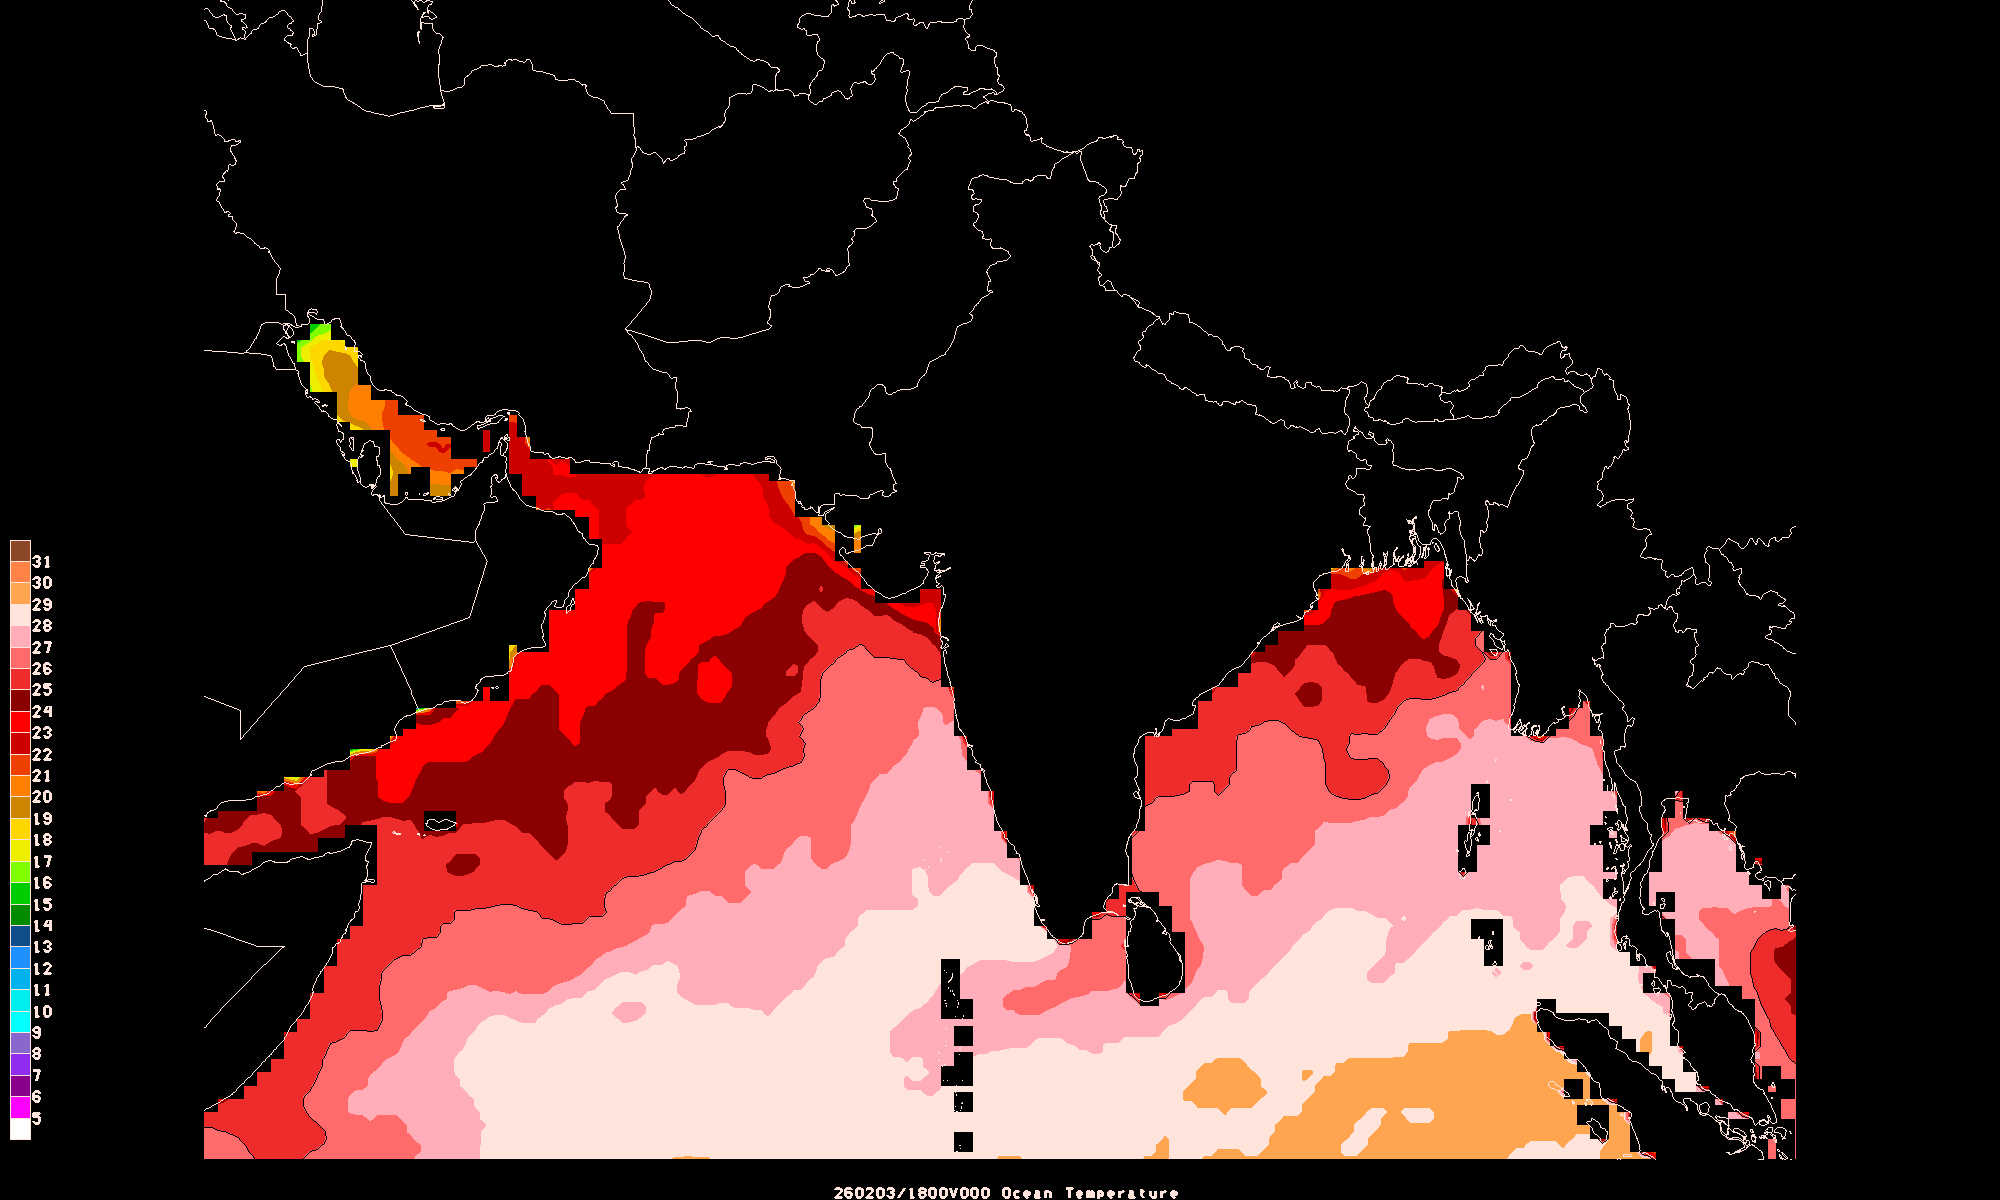 |
 |
 |
 |
 |
 |
| Australia | 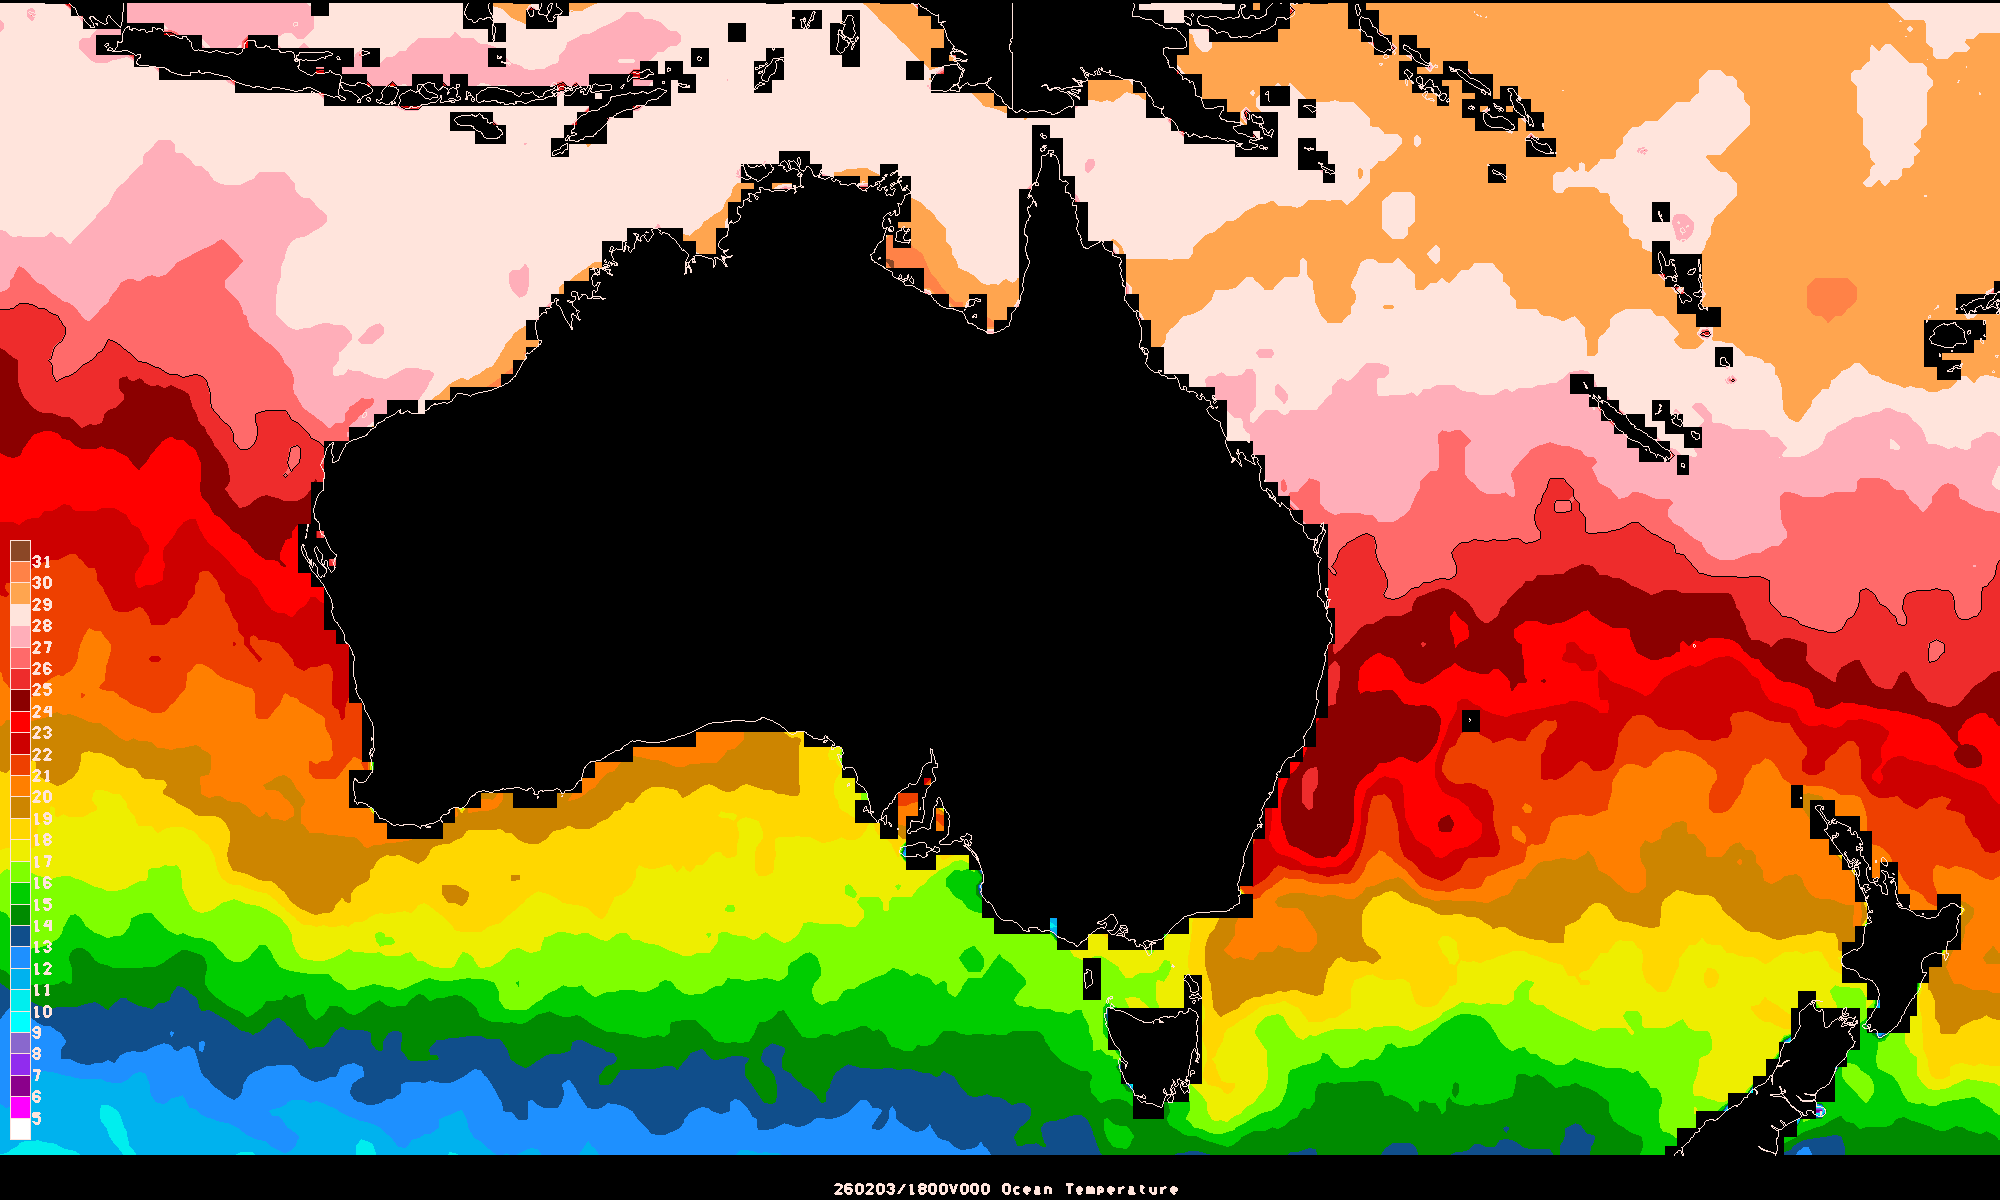 |
 |
 |
 |
 |
 |